


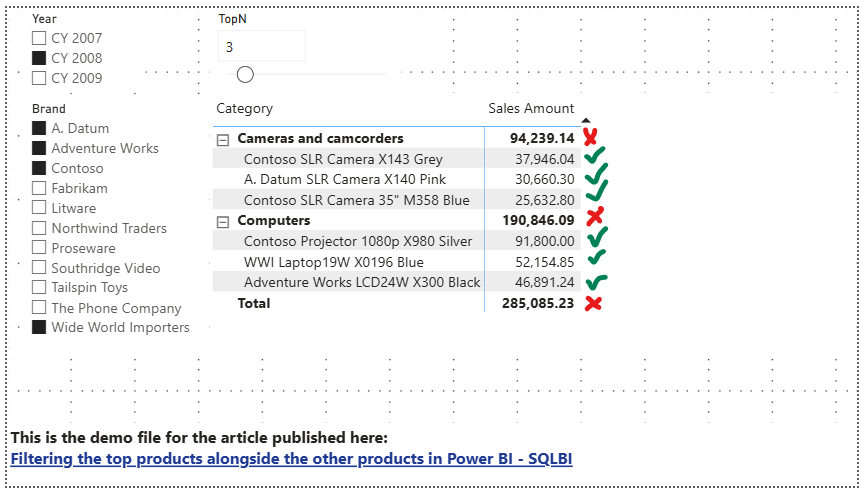
While working on a recent Workout Wednesday Challenge, https://www.workout-wednesday.com/2024-week-31-power-bi-topn-and-others/ .I needed to filter a visualisation to show the "Top N" items while grouping everything else into an "Other" row. To really understand the mechanics i decided to following blog https://www.sqlbi.com/articles/filtering-the-top-products-alongside-the-other-products-in-power-bi/ to get my head around what is going on.
In this post, i want to break down a specific DAX measure that allows you to change aggregations based on what is or isn't filtered on your page.
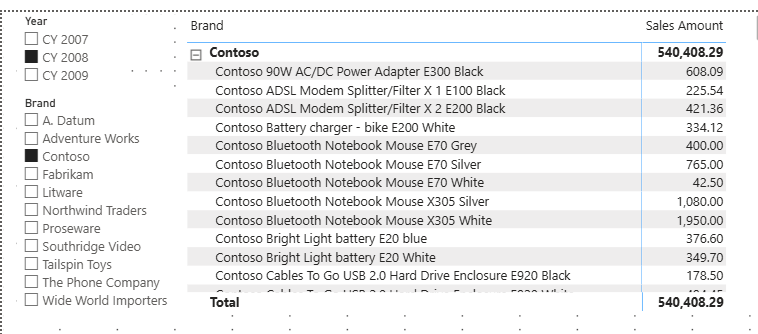
We want to show the total amount of sales for each Product Name nested within its Brand and rank them by sales volume. Importantly, the ranking has to remain dynmaic and needs to be responsive to any slicers on the page.
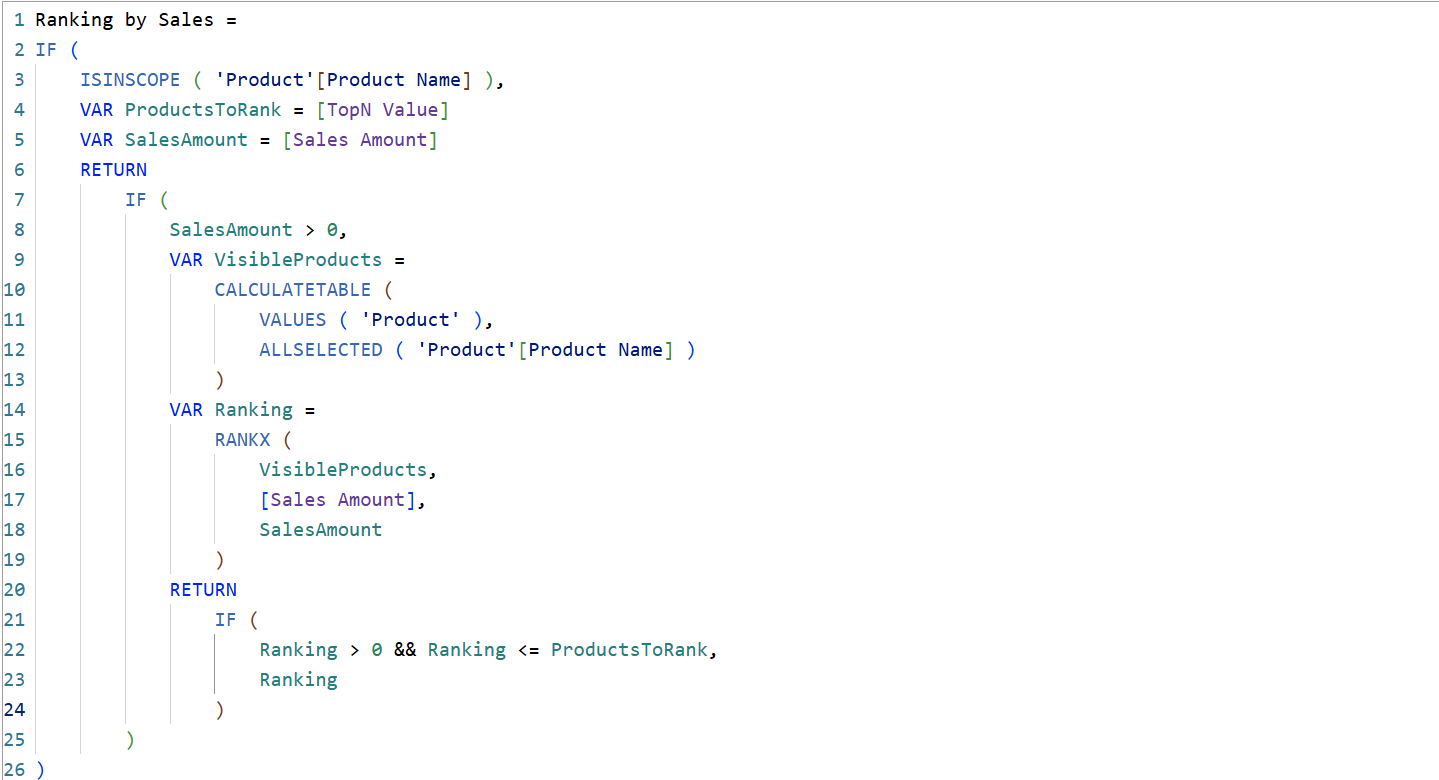
The DAX:
Prerequisites
For this Dax there are two additional components that require setting up:
- Top N Parameter - Slider that allows the user to define the amount of product names we can see ranked .

- Sales Amount Measure : Calculated at the row level using the iterator function ; SUMX()

Why SUMX? we use this function in this context because we need to multiply the quantity by the Net price row by row before summing the totals up. Summarizing the columns first and then multiplying would give us the wrong results.
Step By Step Code Breakdown
The First line of the DAX is telling you whether or not what we are seeing in the view is listed within a certain field or in other words, if Product Name is currently active in the visual.
As shown above our visual contains both Brand and Product Name. ISINSCOPE('Product'[Product Name]) is only true when product name is in the view, and false at the Brand Totals in this visual. This prevents the measure assigning a rank to the Brand.
We are then Declaring Inital Variables
- 'Products ToRank': Grabs the user's selection from the Top N slider.
- 'SalesAmount': Fetches the calculated sales for that specific row.
By nesting these variables inside this IF statement, PowerBI only calculates them when necessary.
The next If statement :
Ensures we only evaluate products whose sales amount is above Zero.
We are then creating a VisibleProducts variable, where we are using CALCULATETABLE DAX Function, in which we are using a function called ALLSELECTED(). Essentially, here we are telling Power BI to return a list of products, respecting any external slicers the user has selected on the report page.
Calculating the Rank and Applying the TopN Cutoff
Lastly, we use RANKX to loop through the table we just stored in the VisibleProducts table and assign a numerical rank based on the Sales Amount measure.
The Last IF statement is then evaluating whether a product's rank falls between 1 and the TOPN parameter, and returns the rank number; if the rank falls outside the specified parameter value, it returns blank.
Hope you found this blog useful! :)