


LODs:
LODs (level of detail) calculations allow you to pull in values at a different level of detail than what is currently in your view. This can be hard to understand in words so here is an example to help.
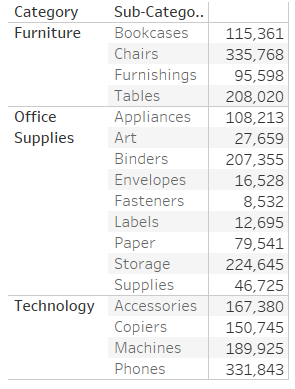
Here I have a table of the sales by sub category and category. This means that each row in this table contains the sum of the sales for each sub category and then the category it sits in. If I wanted to then find out what percentage of sales each sub category makes up within its category, an LOD is one way of working that out.
Due to the granularity being shown in the view, it is not possible to view the sales per sub category as well as the sales by sub category in the same table.
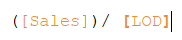
The calculated field for the LOD we want (only showing the category sales) would look like this:

This LOD is working by fixing the value it will return by category. It is essentially aggregating by category. The "SUM([sales]) " is the value being aggregated.
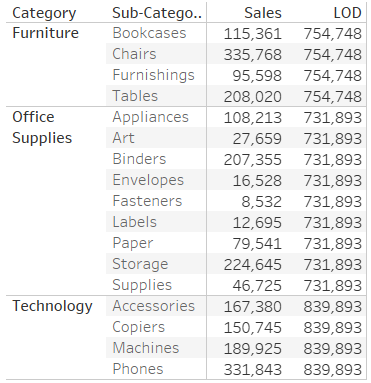
Bringing this LOD into the previous table we can see that the values shown ignore the aggregation of the view (category and sub category) and just return the sum of sales aggregated by category.
This then allows you to perform different calculation comparing sales by sub category and the sales by category in one view. For example, we can now find out what percentage of sales each sub category contributes to the sales by category by simply dividing the sales by the LOD we created.

Another use case for LODs is dates. The next example will be on comparing the sales from different years to show the user the difference.
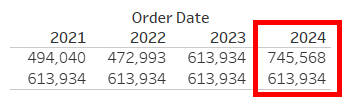
what we want in this case it to be able to show the value for the sales in 2o23 next to the value for 2024. This will allow us to subtract the values from one another to find the difference.
We need to create a calculated field with a fixed LOD to fix the values at the sales for 2023.
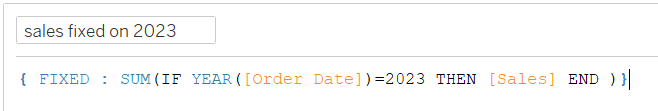
This calculated field is returning the value for sales only when the year of the order date is 2023.

This then allows us to compare any year to 2023.
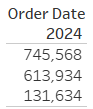
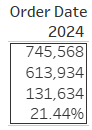
to find the increase in sales from 2023 to 2024 we can subtract the 2024 value from the LOD value.

If we then filter for only 2024 we will be left with the sales for 2024 and 2023 (the LOD) as well as the difference between them.
We can calculate the percentage change by dividing the difference by the 2023 sales. Adding this to the view and then formatting it as a percentage gives us the percentage increase.
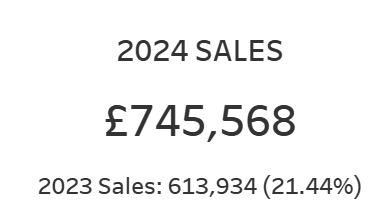
These values can then be used in a KPI.
Hopefully after reading this blog you have a better understanding of how you can use fixed LODs in tableau desktop.