


Tableau containers are an essential tool for building clean, well-organized dashboards. When used effectively, containers help you guide viewers through a logical story, making insights easier to see and understand.
This post walks you through the fundamentals of containers in Tableau — how to plan, implement, and troubleshoot them — as part of a larger dashboard design process. You’ll also find resources at the end to help improve your overall data visualization practices.
Prepping the Dashboard
- Plan Your View
- Before dragging any charts into the dashboard, it's a good idea to wireframe your layout. Sketching a rough layout lets you: a) Visualize how information will flow; b) Choose the right type of containers; c) Avoid clutter or misalignment later.
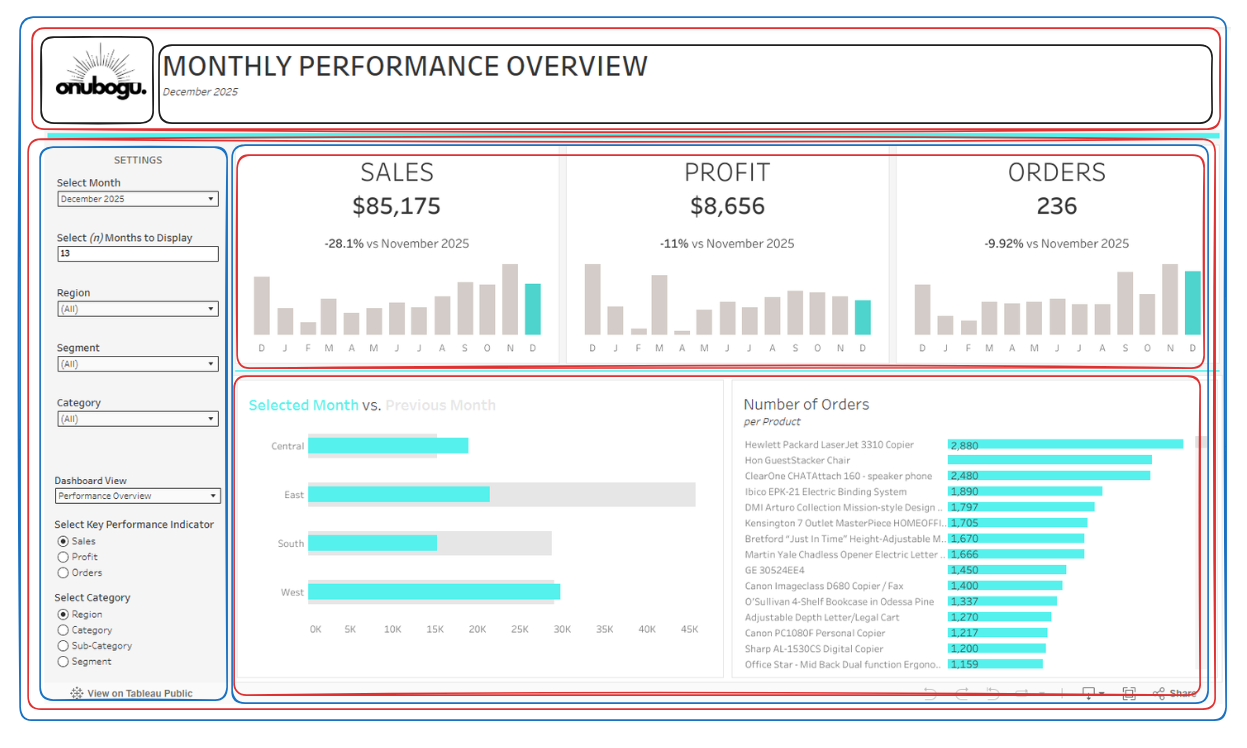
- The blue-lined containers are vertical containers, where objects are stacked top-to-bottom. Conversely, the red-line containers are horizontal containers, where objects are stacked side-to-side. You can see that the entire main view is one big vertical container.
Here’s an example of how a dashboard is organized with containers:
Container Type Cheat Sheet
Set Up Your Dashboard
- In the Dashboard, navigate to the left panel and right-click on the Phone layout. Delete it. This can counterintuitively make your dashboard more difficult to view on a phone.
- Then re-size your canvas by unfixing the dimensions and entering the height and width you want your dashboard to be.
- Create main container
- Once you’ve selected the appropriate container type, float it onto your canvas. Navigate to the Layout tab. Resize your container according to the actual size you’d like your entire dashboard to be.
- Now you’re ready to nest additional containers inside this main container to organize your charts, filters, and text.
Formatting
Fit Options
- Click the drop-down menu on a chart and choose "Fit."
- Options like "Fit Width" or "Entire View" control how the chart fills its container.
Edit Titles/Text
- Click on a title or label, then choose "Edit" to change the text, font, size, and style.
- You can also right-click any text element to access formatting options.
Resize Sheets and Containers
- Resize sheets or containers by dragging their edges in the dashboard.
- You can also set exact height and width in the Layout pane when the object is selected.
Adjusting Padding
- Select a container or object and open the Layout pane.
- Use the padding settings to add space inside the object’s borders (top, bottom, left, right).
Common Issues
- Mystery ‘Tiled’ Container in Item Hierarchy:
By navigating to the ‘Layout’ tab of the left-hand panel, you should be able to view the item hierarchy of items in your dashboard. Sometimes, Tableau auto-populates a container (always named ‘Tiled) which is intended to help organize your dashboard but can be a bit meddlesome if you’ve meticulously created your hierarchy. If it does pop up, you can right click on it and Remove from Dashboard. Just be mindful that no information you actually need is nested inside of it.
- Fixed Height/Width:
Sometimes, while manually resizing your dashboard, Tableau will automatically fix the width and height of containers or objects in containers. This can be a nonissue; when it is an issue, it creates arbitrary spacing usually at the bottom or the side of a container. You can easily fix this by right-clicking the container or object and unticking 'Fix Width' or 'Fix Height.'