


2025 Week 40 – Lorna Brown’s Challenge
For Week 40 of 2025, Lorna Brown’s challenge focused on building a parameterized scatter plot that zooms in when you highlight points and resets to the full view when you click a reset button.
This build was a great exercise in combining Level of Detail (LoD) calculations, parameters, and parameter actions to create an interactive user experience. Here are some key takeaways from the process and link to her post with solution.
Level of Detail (LoD) Calculations
My initial LoD expressions weren’t fixed on anything and simply took the maximum or minimum of the x-axis (Sales) or y-axis (Profit). The intent was to use these fields later to drive the parameter actions that controlled the zoom and reset behavior.
Challenge:
This setup didn’t have the right granularity to identify the maximum profit per customer.
Solution:
I created a nested LoD.
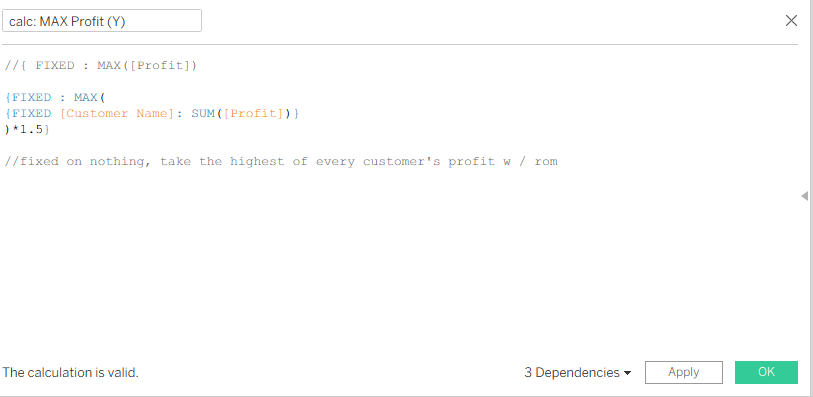
The nested LoD calculates the highest profit per customer across the entire dataset (multiplied by a small constant). Similar calculations for the minimum and maximum of both axes ensure that, when you hit the reset button, the scatter plot fully reverts to show all marks in the view.
Configuring Dynamic Axes
One key learning from this challenge was discovering that axes can be fixed on parameters. This allows the x and y axes to adjust dynamically based on user interactions—an elegant feature that unlocks smooth, parameter-driven zoom functionality.
Setting Up Parameter Actions
Configuring the parameter actions took some time to get right—especially those linked to the Zoom function. Initially, I assumed the parameters should update based on the nested LoDs I’d created. However, the correct approach was to base them directly on the fields used in the view—Profit and Sales (the pills on Rows and Columns).
In practice, each parameter updates using the aggregation of the visible marks. For example, if a parameter controls the maximum value of the x-axis (Sales), it’s updated with the highest visible Sales value from the selected data points.
Final Dashboard
The end result is a fully interactive scatter plot that lets users zoom in on specific selections and easily return to the full view with a single click.