This week I learned SQL, and to consolidate my knowledge I wanted to attempt a Preppin’ Data Challenge (2022 Week 3).
This challenge asks you to combine two datasets from ‘The Prep School’ to see how many students are passing their classes. One dataset includes student information, and the output needs the ‘Gender’ data field from this. The other dataset includes students grades in each subject, and requires pivoting to get the required data fields for the output.
I started by reading through the challenge and making a plan for the steps I’d need to take:
- Pivot the grades dataset to a row per student and subject
- Joining the two datasets on Student ID
- Create a field of Pass/Fail, where a pass is a score of 75+
- Aggregate to a row for each student, to find average grade and total passes
Then I planned and did each step in SQL:
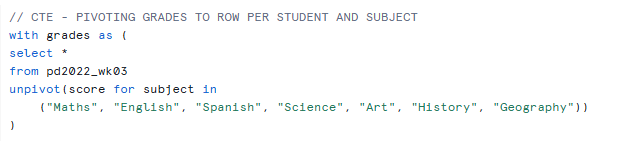
Step 1:
Pivot to a row per student and subject (as CTE):
FROM GRADES
UNPIVOT (SCORE FOR SUBJECT IN
(Maths, English, Spanish, Science, Art, History, Geography)
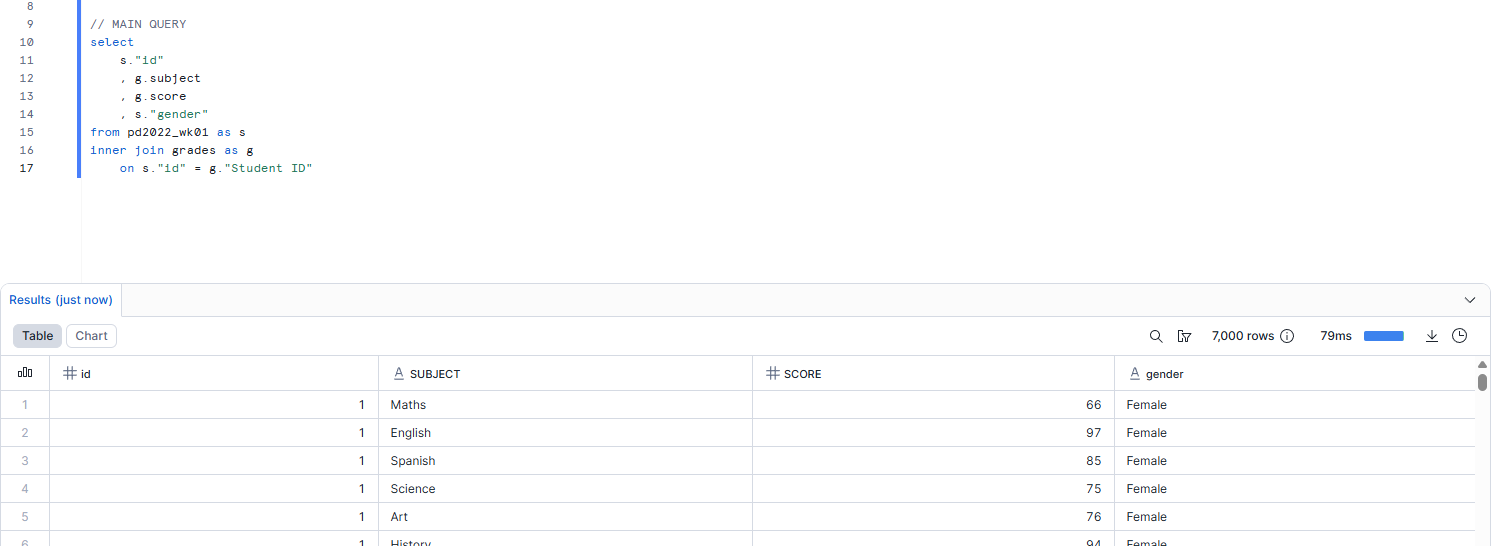
Step 2:
Join on student ID (main query):
SELECT *
FROM STUDENT INFO
INNER JOIN GRADES
ON STUDENT ID = ID
(only need to return STUDENT ID | SUBJECT | SCORE | GENDER)
Step 3:
Field of pass rate (in main query):
IFF(SCORE>=75, 1, 0)
Aggregate to find total passes and avg score (to 1dp):
AVG(SCORE)
SUM( PASS RATE ) = SUM( IFF(SCORE>=75, 1, 0) )
…
GROUP BY STUDENT ID
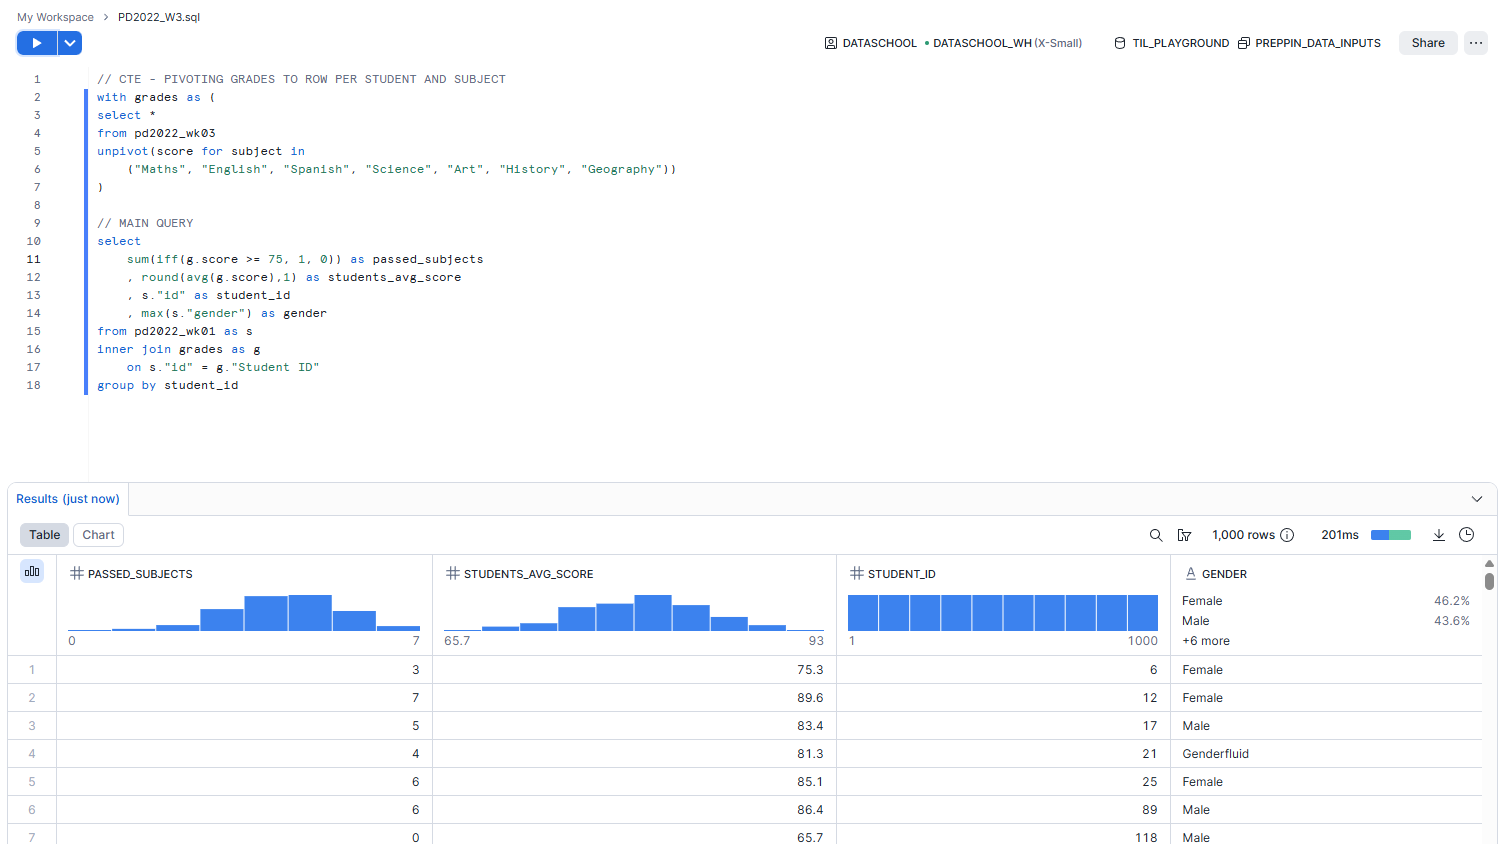
Then I put all these steps together, and was left with the following output: