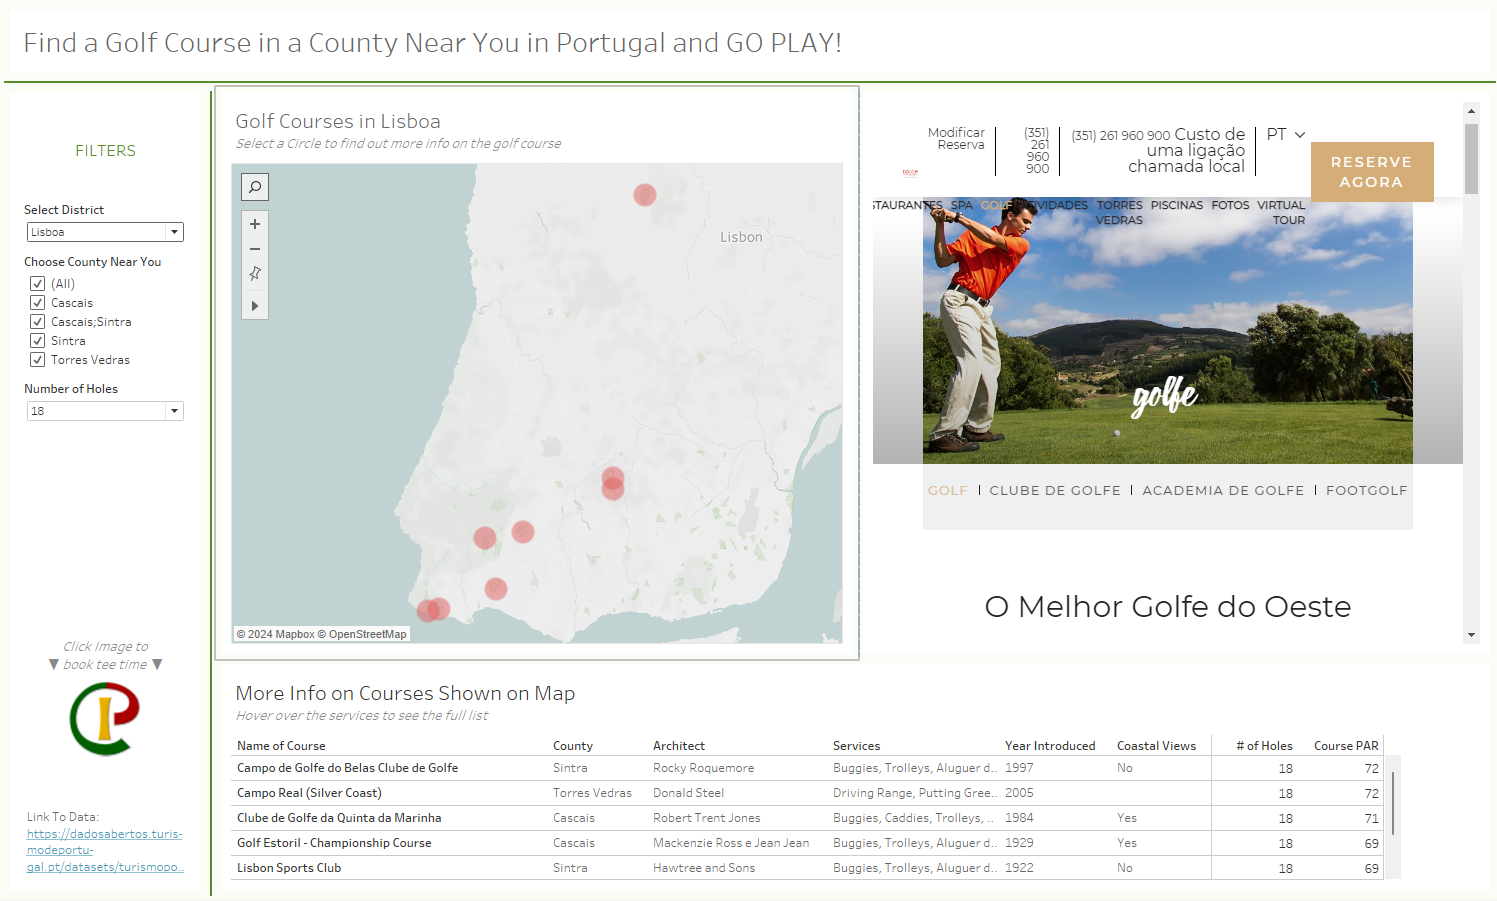
Today we were given a dataset that was completely in Portuguese. The dataset was on golf courses in portugal. It contained various different fields pertaining to indivdual golf courses such as the name of the course, where it is located, who was the architect, year it was built, etc. I immediately started off by translating all of the headers in alteryx to get a better idea of the data. Then figured out what one row of the dataset represented. After that I needed to start brainstorming ideas on what to create. My first thought was to have the user type in their city or town and have a buffer zone around them, which they would set as well. They would then see the golf courses around them, along with the distance away. You would then be able to select a course and the table would filter to that course. The website would generate on the dashboard for that selected course. I used alteryx to fix a few things on the dataset before it was tableau ready. The latitude and longitude needed to be split, a few words needed translation, and unused fields needed to be removed. I created a sketch for this and after completing it I began to build. I soon realized that I would need to supplement the data with towns and their coordinates if I wanted to have that point on the map and create the buffer and distances. I looked for a good amount of time for a dataset, but couldn't find one. The only data I found I would have to webscrape 20+ pages of data and realized I don't have the scope for that. I quickly pivoted for a more simplified version of the dashboard I wanted. My thought was I could use the data to help players find a course and book tee times. This became the dashboard I have completed for this project. For the dashboard I still used the map, table, and weblink. The dashboard allows the user to select a district and multiple counties and that filters the map and table. The table shows a more detailed description of the courses in view. The map allows the user to then select a course to view that courses website. The user can then click the image to be brought to a website to book the tee time. This I wanted to DZV in where the website was to book a tee time on the dashboard. I ran out of time and wasn't able to do this.
I feel as though I scoped okay for this project, but on the next one I need to figure out what is possible with the data I have a bit earlier. I don't feel I was pressed for time, but I would still like to have more time for the dashboard and creating more interactivity. I did have a timeline plan for scope, which I followed as closely as I could and gave me enough time to get everything done. I will use this same plan for the rest of the week.