For Learn What The Data School Learns (LWTDSL) we each chose a topic to teach to the participants coming to the session. My topic was drilldowns. I took copious notes of how I would like the presentation to go and here they are. This blog will also serve as a good way of learning drilldowns step-by-step.
Tableau Drilldown is the feature that addresses the hierarchical data view of the visualization. Essentially allows the user to quickly look at different levels of granularity within the data.
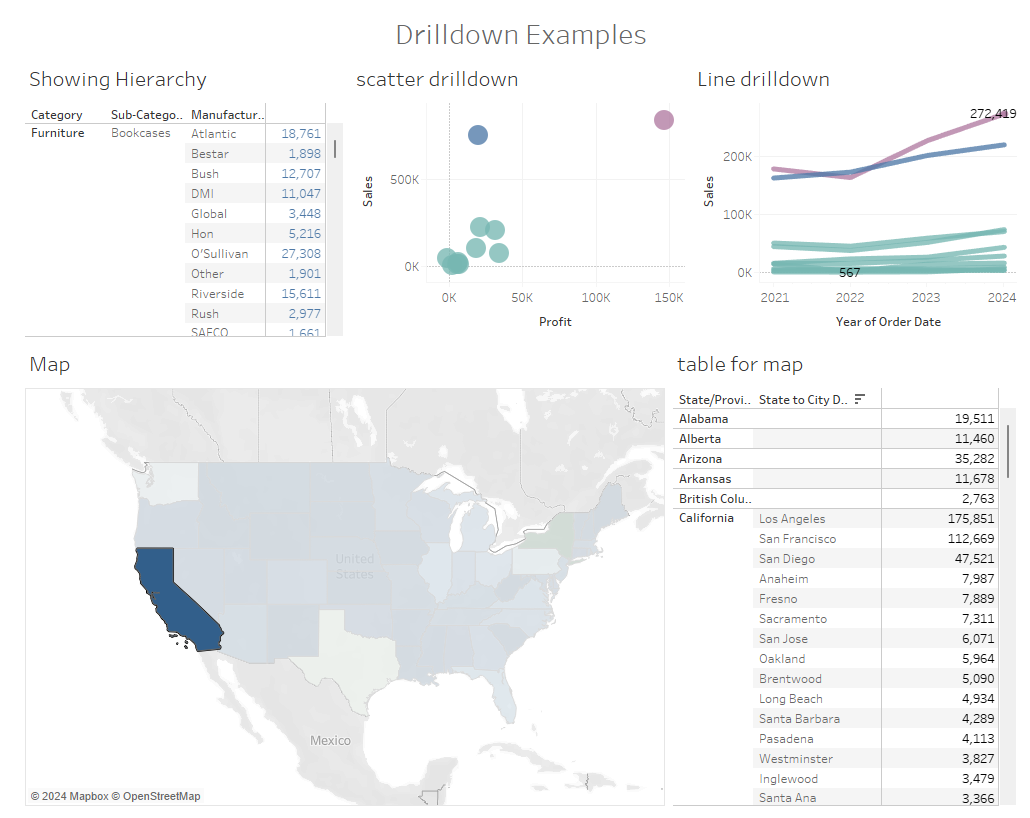
- As we can see drilldowns can be used with many different charts, but should be noted that they should only be used if they help you to get to your insights more efficiently
EXAMPLE #1
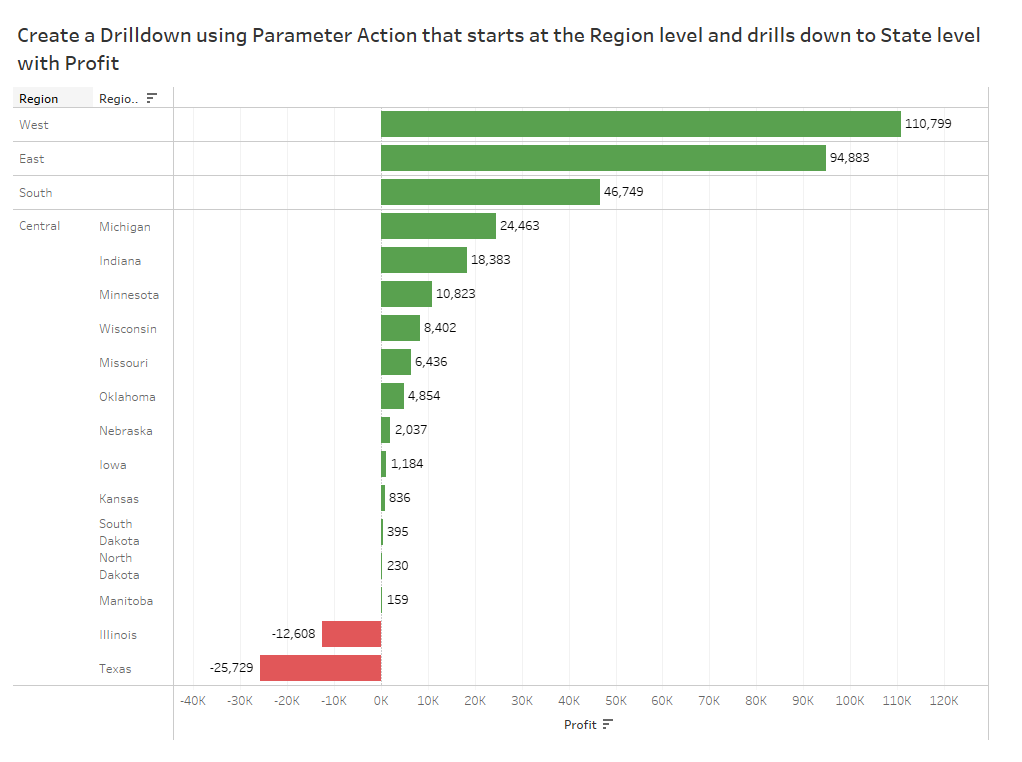
- Create a drilldown using Parameter Action that starts at the region level and drills down to state level with profit
- The first step is always to bring the fields into Tableau that are needed. I like to do this first to have an idea of what we will be looking at
- Next, create the parameter
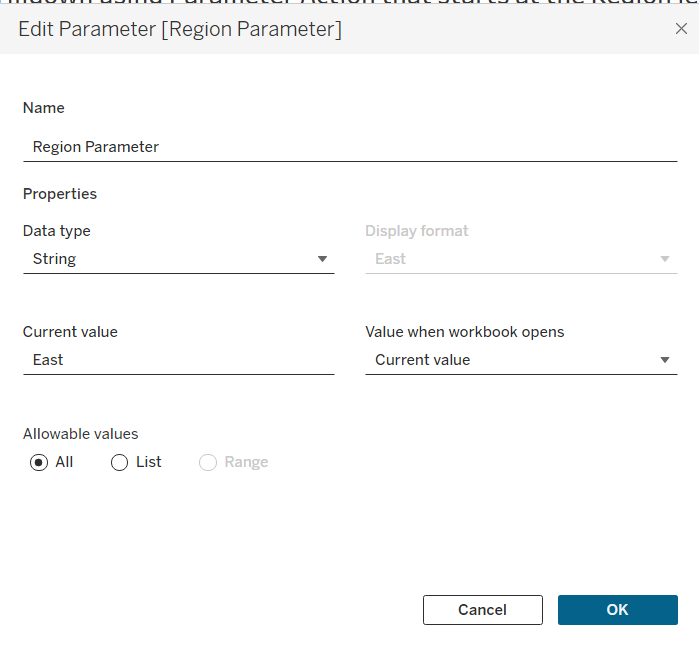
- The current value can be left as is since we have not told Tableau to put a value inside yet
- Create the calculated field
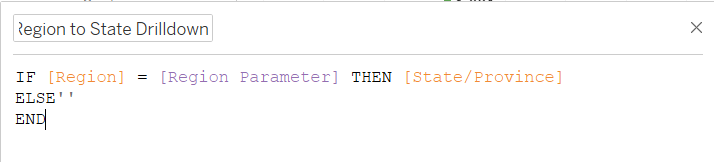
- ELSE’ ‘ will prevent null values to show when a category is not in the parameter
- Drag that calculated field into rows over the state/province field
- Last step to creating the interactivity of the chart is to make a Parameter Action
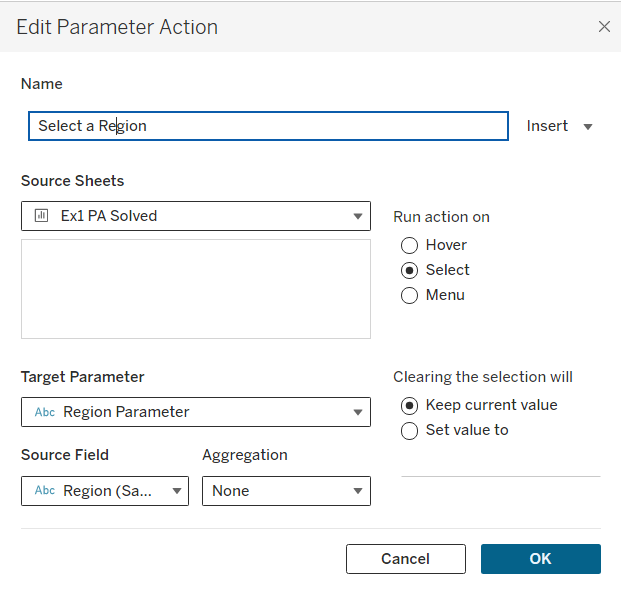
- On Select we want to Target the Region Parameter using Region as our source field
- Keep the current value when clearing and we don’t want to aggregate
- Now the chart is setup we can do a few things to make it more presentable
- We can create a calculated field to show profit and loss
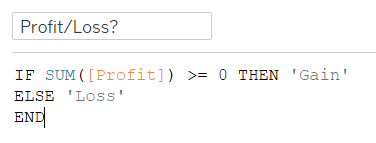
- Drag this calculation onto color, then we can also show labels
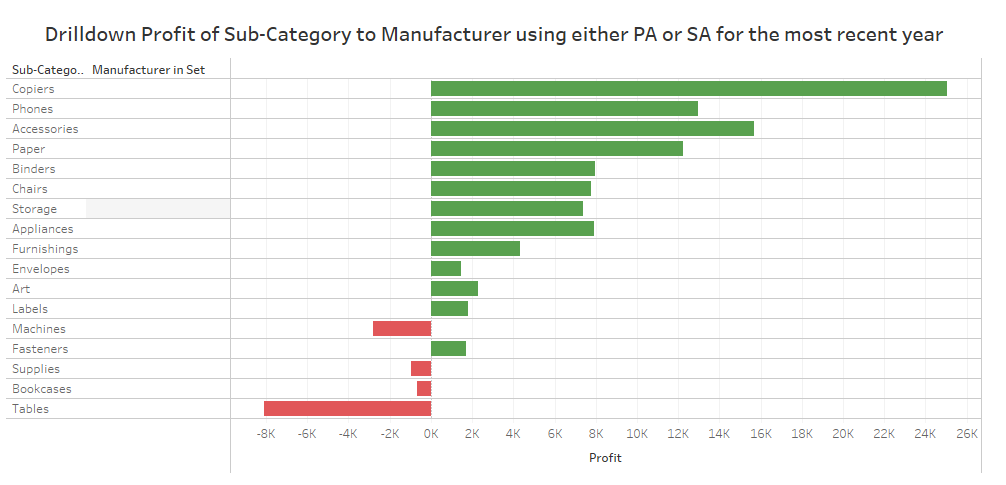
EXAMPLE # 2
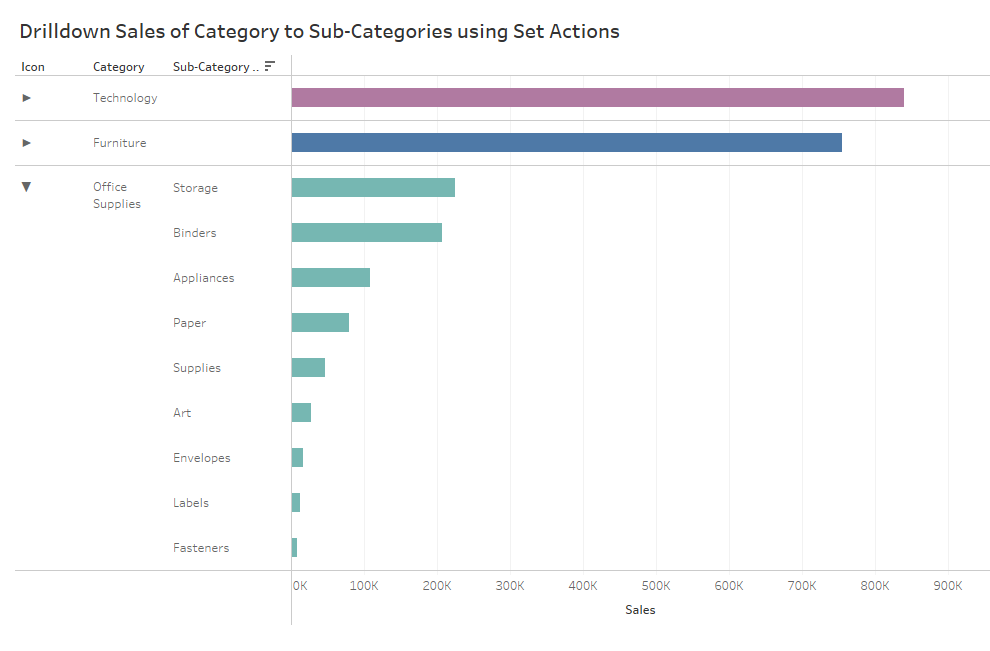
- Make a drilldown using sales of category and sub-category with Set Actions
- Same as before bring the fields onto the sheet
- Create a set for category by right clicking on category and select 'create set'. Select one category
- Drag the set in after ‘Category’ pill
- Create a calculated field that will only show the subcategories that are in the set
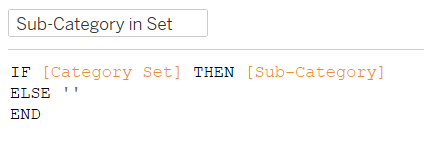
- Drag this pill over the sub-category pill
- Next, we will create a set action which will allow us to choose what is in the set
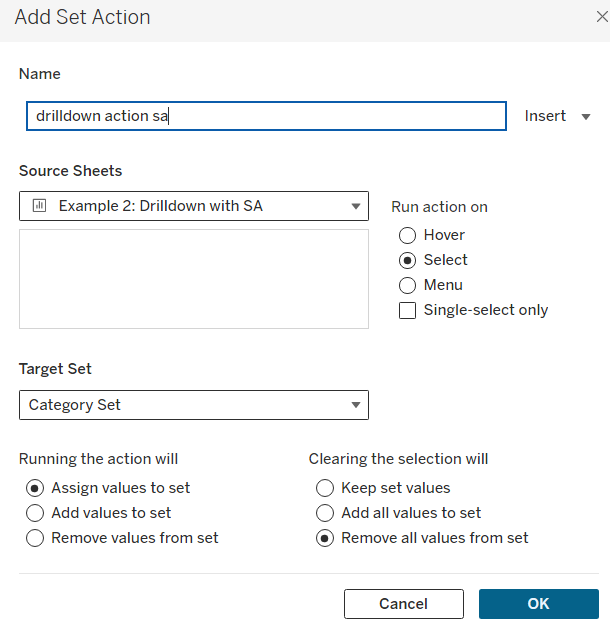
- Now we can see that if we click a bar that it will drilldown to sub categories
- What is nice about sets is when you click out of them it will drill back up to categories
- To clean this up we can put category to color, put labels on ‘selected’
- Lets say we still want the bars to stay highlighted we can do this with a highlight action
- Create a calculated field with any string in it and then add it to detail
- Then create a highlight action just using a dummy field
- Create a calculated field called 'Dummy' and put any string inside
- ex/ 'Highlight'
- Create a calculated field called 'Dummy' and put any string inside
- Turn off tooltips
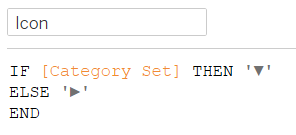
- To make the chart even more advanced we can add arrows to show which category is selected
- For this we need to make a calculated field
- We can put this pill next to category
- In order to sort the categories we need to duplicate the category field and place it in the very front of the pills
- Lastly we can remove some header
Additional Practice & Links:
https://workout-wednesday.com/?s=drilldown
Practice: