we were tasked with downloading boy band data from github. link here https://github.com/the-pudding/data/blob/master/boybands/bands.csv and here https://github.com/thepudding/data/blob/master/boybands/boys.csv
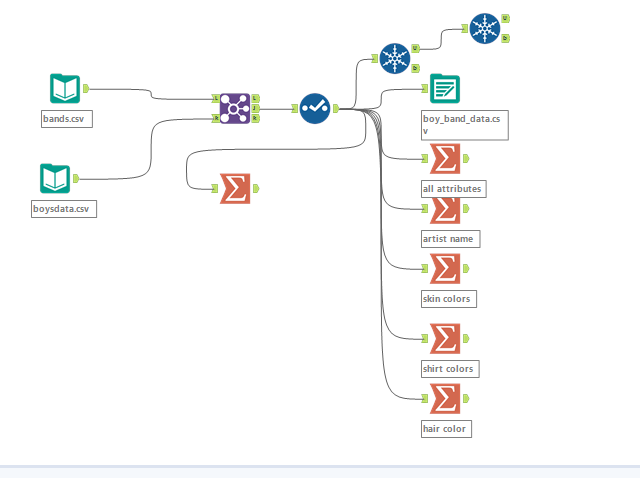
We were given the freedom to do whatever we pleased with the dashboard. I did play around with the data in Alteryx as i brainstormed what to do with the dataset.
I brain stormed several ideas and spent the first half of the day doing that and soon realized i was running out of time.
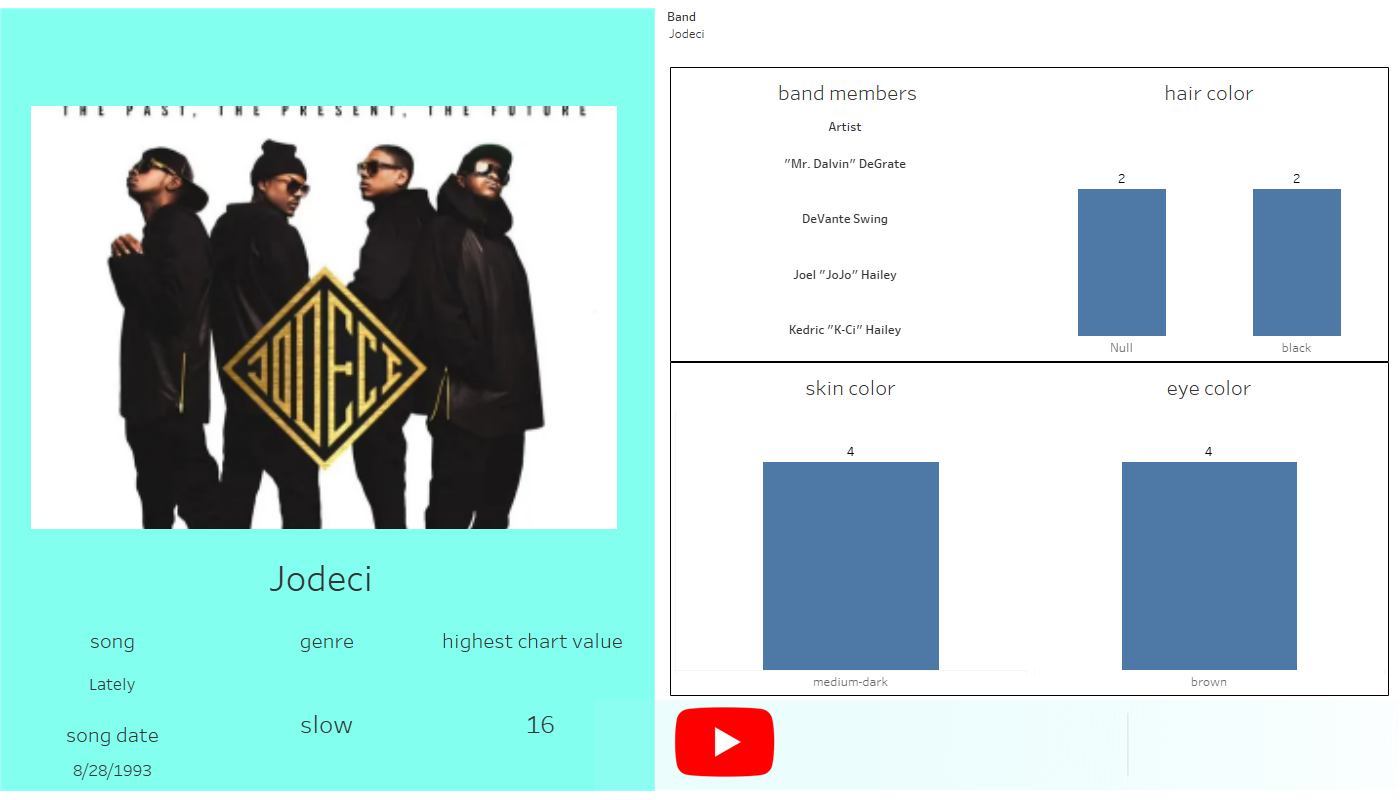
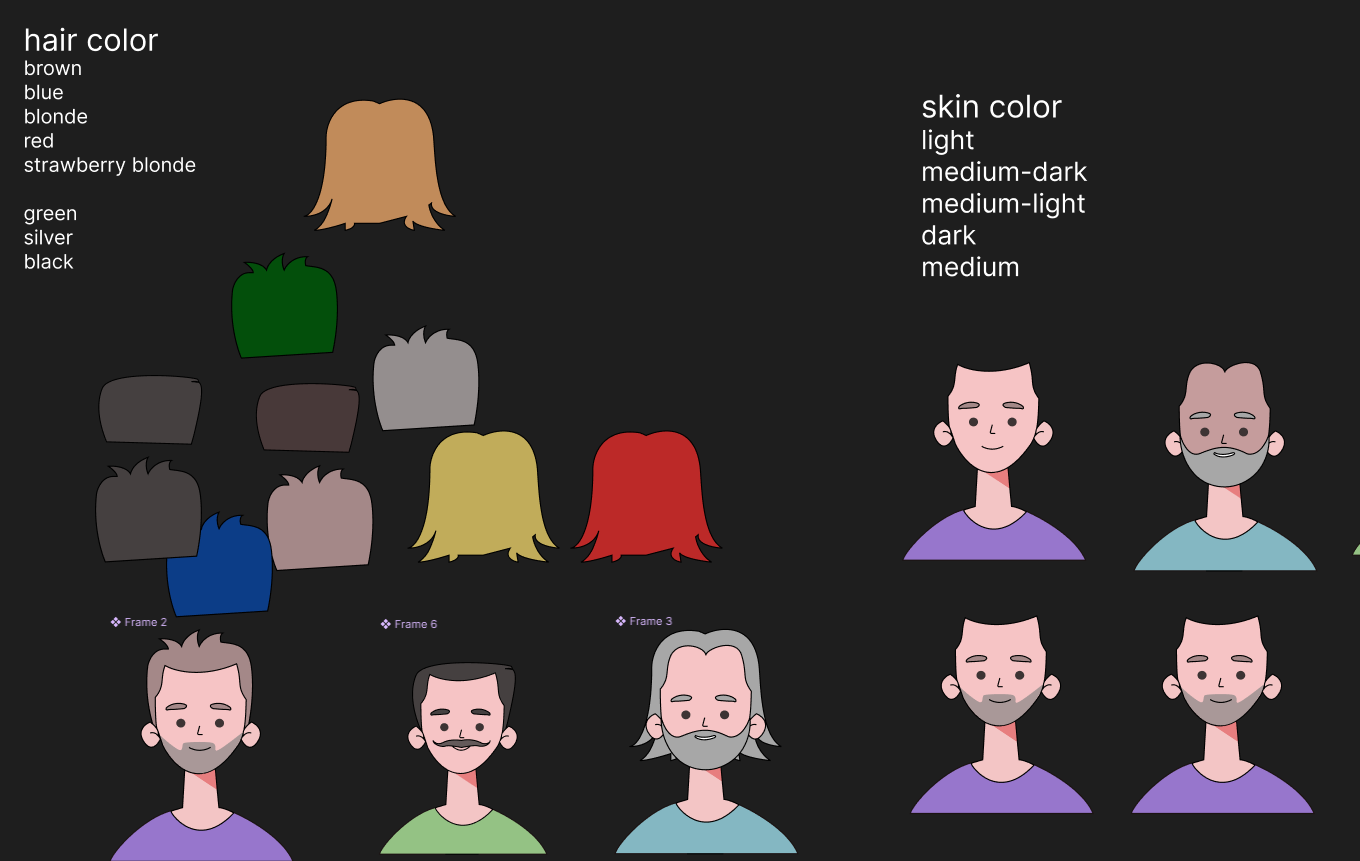
I initally wanted to create a unique shape for every band member in the dataset based off their attributes. For example Hair color, skin color, shirt color etc, I soon realized that would take too much time being over 200 artist in the dataset.
Realizing i was running short on time i had to revert back to my pre-data school days of simplified non analytical floating charts .