


Looking back on my first week at the Data School, I soaked up a ton of information and met some incredible people both within my cohort and across the wider organization which made the week fly by!
At first, diving into the theory behind data structures, terminology, data sources and databases felt daunting, but these fundamentals provide a solid foundation to build on. The real fun began when we were introduced to Data Prep, which was broken down into data cleaning and reshaping. Since data can exist in many different forms and contexts, and isn’t always in the right shape for analysis, it was great to put these concepts into practice using Tableau Prep Builder.
So let’s dive into the fun once again, because why not?
I. Data Cleaning
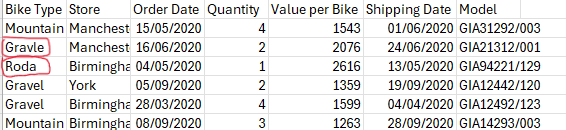
Let’s look at the following dataset. We can see that the ‘Bike Type’ field contains misspellings such as ‘Roda’ instead of ‘Road’ and ‘Gravle’ instead of ‘Gravel’.
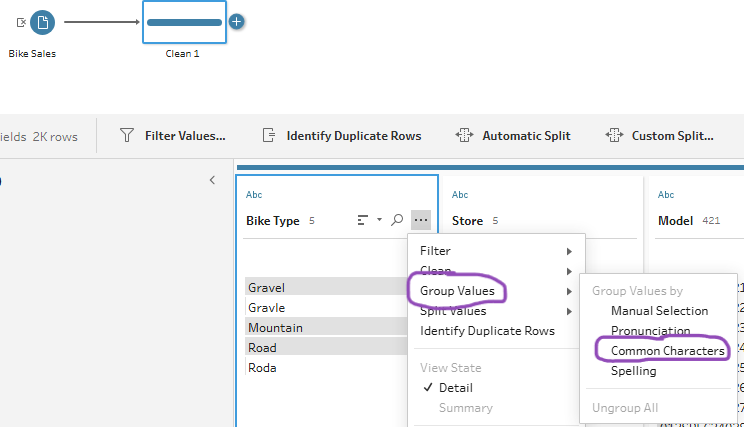
Once the csv file is loaded onto Prep Builder, we have the option to clean the typos by adding a clean step and grouping values based on common characters.
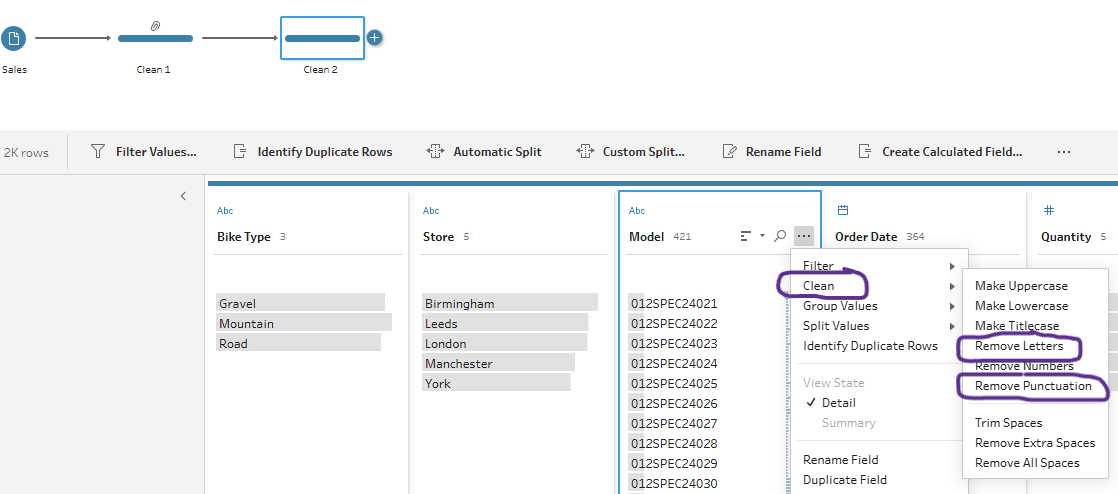
Then, if we were interested only in the brand of the bikes we could also add another clean step to remove letters and punctuation from each model.
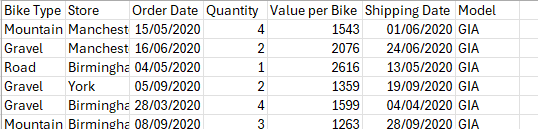
And voilà your new clean data should look like this.
Pretty simple right? These are just a couple basic examples of when you might need to clean your data - although this might not always be the case.
II. Data Reshaping
There are times when the data isn’t quite in the structure that we might expect and that’s when data reshaping comes into play. This week we’ve learned two ways to reshape data, through Pivoting and Aggregation.
A. Pivoting
You can pivot data in two ways: Columns → Rows or Rows → Columns. (Pro tip: Columns to Rows makes your dataset taller, Rows to Columns makes it wider).
Let’s look at the following data. There are multiple data fields that have similar characteristics like ‘New-’ and ‘Existing-’. These can be pivoted into rows so that each row represents a single observation (Date + Product Type), which makes it easier to filter, aggregate, or visualize.
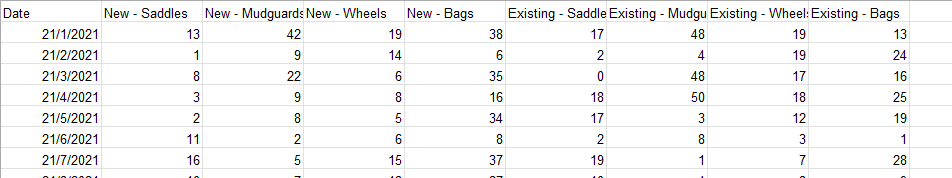
To achieve this, in Prep Builder you can pivot the Columns → Rows using the wildcard search based on the ‘-’ between ‘New’ and ‘Saddles’.
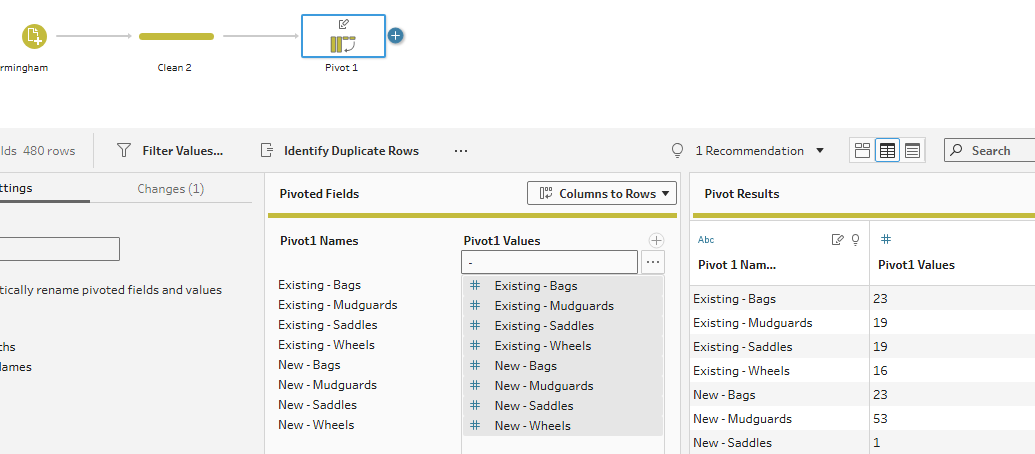
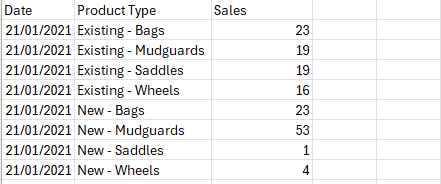
The end output will look like this:
B. Aggregation
Aggregating data is useful when you want to group it by categories and calculate summary metrics such as totals, averages, counts, or percentages. For example, you might aggregate to compare the total number of products sold by customer type and product type.
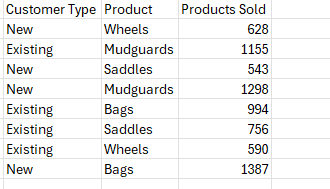
Using the same data as above, we can achieve this by dragging Customer Type and Product fields into the Grouped Fields section. Then, drag the Products Sold field into the Aggregated Field.
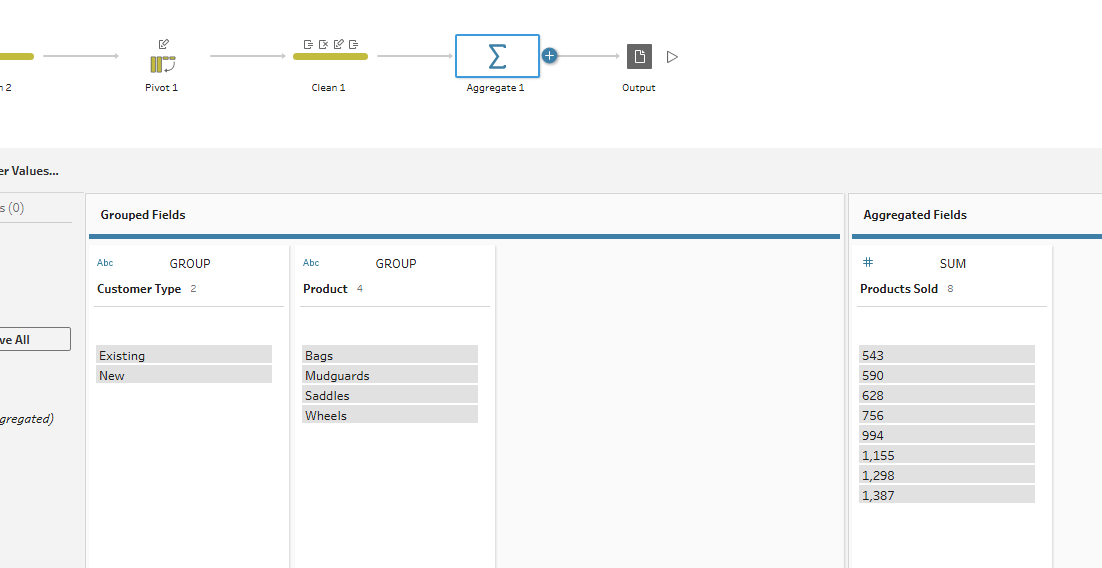
The end output will look like this:
That’s a brief recap of what we’ve covered so far, excited for what’s coming next week! Stay tuned to learn how to get the most out of the clean data you’ve prepared!
PS: to make life easier, planning your prep is just as important as prepping your data - I’m still new to this. It will not only save you lots of time figuring out what works and what doesn’t, but will also create the necessary documentation for workflow repeatability.