


DAX knowledge is essential in making the most of data analysis in PowerBI, as it enables you to get deeper into the details and:
- Perform advanced calculations and summaries
- Organize data in a meaningful way (groups, bins)
- Insert or create additional data
- Deliver more user focused insights
Some of the DAX functions that I came across and thought were worth becoming familiar with are:
CALCULATE
Syntax: CALCULATE([expression], [filter1], [filter2])
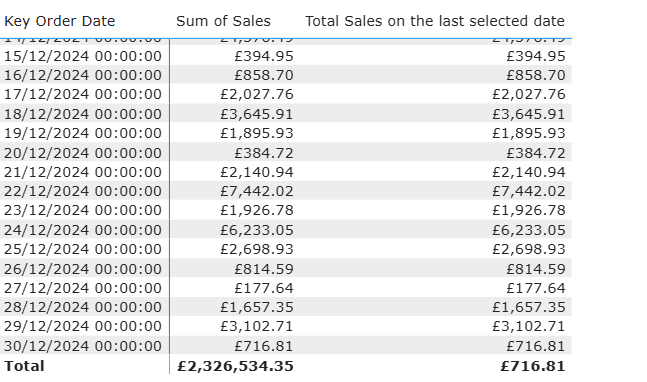
How it works: Changes the context of a calculation, so it only applies the expression to a defined group of fields that fulfill a condition.
Example:
Total sales on the last selected date =
CALCULATE (
SUM ( Sales[Sales Amount] ),
'Sales'[OrderDateKey] = MAX ( 'Sales'[OrderDateKey] )
)
SUMX
Syntax: SUMX( [table], [expression] )
How it works: Evaluates a specific expression for every row in a table and then sums up those individual results. Unlike the traditional SUM function, it allows you to multiply or combine columns per row.
Example: If you have a sales table and want to calculate total sales, you cannot use SUM(Sales[Price] * Sales[Quantity]) because SUM only accepts one column. Instead, you use SUMX:
Total Sales =
SUMX( Sales, Sales[Quantity] * Sales[Unit Price] )
ALL
Syntax: ALL( <table> | <column> [, <column>...] )
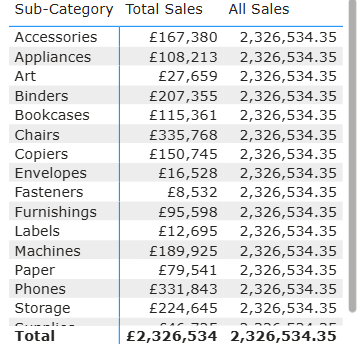
How it works: Used to bypass or ignore existing filters in a report. It is primarily used to calculate "Grand Totals" or denominators in percentage-of-total calculations, ensuring that a specific value remains constant even as a user interacts with slicers or visual categories.
Example: If you specifically want to remove any active filters or slicer selections from the "Sub-Category" column, ensuring the total doesn't change when you interact with that slicer. Note that Total Sales changes for each subcategory but All Sales represents the grand total sales from all the subcategories.
All Sales =
CALCULATE( [Total Sales], ALL(Sub-categories) )
DIVIDE
Syntax: DIVIDE(<numerator>, <denominator>, [<alternateResult>])
How it works: It divides a numerator by a denominator (either of which can be a column) safely, meaning that it handles division-by-zero errors gracefully by replacing those with Null instead of infinity.
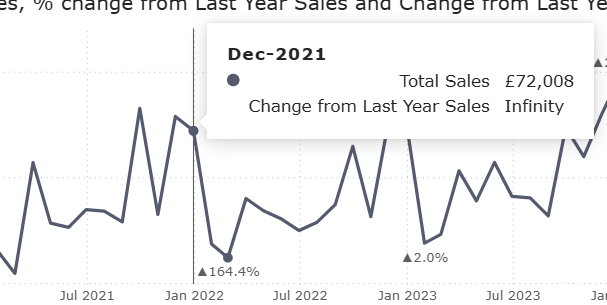
Example: To avoid the scenario above you need to use the DIVIDE function, so that your report doesn't have meaningless tooltips like "Infinity" as your % of change from LY sales. DIVIDE will simply replace those with Nulls which will not show in the tooltips!
% change from Last Year Sales =
DIVIDE(([Total Sales]-[Total Sales Same Period LY]),[Total Sales Same Period LY])
FILTER
Syntax: FILTER(<table>, <filter_expression>)
How it works: Unlike a visual slicer, the FILTER function results in a new temporary table that other functions (like SUMX or CALCULATE) can use. As an iterator function it scans the table row-by-row to test an expression, which can often be resource-intensive on very large datasets.
Example: You should use the FILTER function specifically when your criteria involve measures or complex logic between two columns. Imagine you want to calculate the total sales, but only for individual transactions where the sale amount was greater than £500.
High Value Sales =
CALCULATE( SUM(Orders[Sales]), FILTER( Orders, Orders[Sales] > 500 ) )
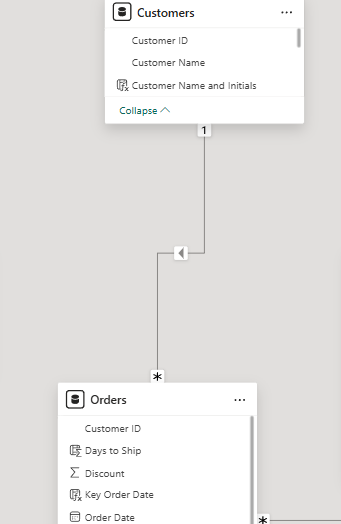
RELATED
Syntax: RELATED(<column>)
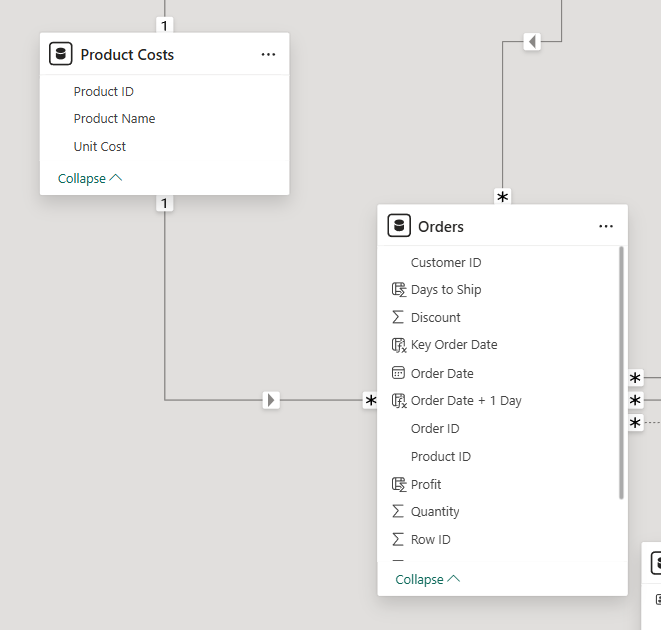
How it works: Used to retrieve a value from a different table that is related to the current table through a Many-to-One relationship (fetches a single value from the "one" side). It is essentially the Power BI equivalent of a "VLOOKUP" or "XLOOKUP" in Excel, but it operates automatically based on the relationships you have defined in your data model.
Example: Because of the way the relationship between the 'Product Costs' and 'Orders' only exists in One Way and not both ways the returned SUM of Unit Cost from the Product Costs will be the Grand total value. The Orders doesn't filter the values inside the Product Costs because the arrow points to the Orders and not the other way.
Therefore, you need to create a column inside the Orders to pull in the Unit Cost from the Product Costs with the following calculation:
Unit Cost =
RELATED('Product Costs'[Unit Cost])
RELATEDTABLE
Syntax: RELATEDTABLE(<TableName>)
How it works: While the RELATED function pulls a single value from the "one" side of a relationship, RELATEDTABLE does the opposite: it reaches from the "one" side down to the "many" side to return a complete table of rows that match the current record. Since RELATEDTABLE returns a table, you almost always wrap it in an aggregation function like COUNTROWS or SUMX to turn that table into a single number.
Example: If you want to bring in a value from a different granularity table (Orders) into your single row granularity (i.e. Customers) make a column in your Customers table like the below:
Total Quantity =
SUMX( RELATEDTABLE(Orders), Orders[Quantity])
IF
Syntax: IF( <logical_test>, <value_if_true>, [<value_if_false>] )
How it works: Checks a condition and returns one value if the condition is TRUE, and another value if it is FALSE. It is the most fundamental way to create conditional logic within your Power BI measures and calculated columns. I found this useful in creating color coding for different values.
Example:
Profit > Avg sub-cat Profit =
IF( [Total Profit] > [Avg Sub-category Profit] , "Dark Red" , "Azure")
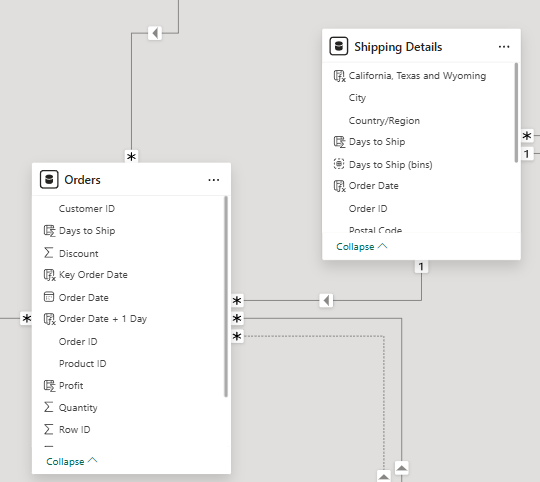
CROSSFILTER
Syntax: CROSSFILTER( <columnName1>, <columnName2>, <direction> )
How it works: Acts as a specialized "filter modifier" used within a CALCULATE statement to change how a relationship between two tables behaves during a specific calculation. Its most common use is to enable bi-directional filtering temporarily or to disable a relationship entirely for a single measure.
Example: If you need to use values from different tables that have a single to many relationship to the main fact table, you will need to create a new measure to enable the visual to only use a "Both" way relationship for a specific calculation like the below. This will allow the main table to filter values from the target table by switching the direction of flow.
Distinct Count of PostCodes by Customer =
CALCULATE(
DISTINCTCOUNT('Shipping Details'[Postal Code])
, CROSSFILTER
(Orders[Order ID]
,'Shipping Details'[Order ID]
,Both
)
)
That's all for now, PowerBI has definitely been full of tricks and surprises so keep your eyes peeled for more content as I am still learning myself teehee