


When I was introduced to Alteryx, I found both the Cross-Tab and Transpose tools easy to mix up, and I found myself using trial-and-error to understand the configuration pane for both. Here I will break down what both reshaping tools do, and how to approach their configuration panes.
Cross-Tab

CROSS TAB - AKA Pivot, or Rows-to-Columns Pivot (transforming long data to wide data)
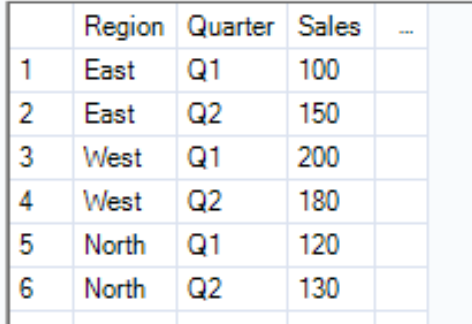
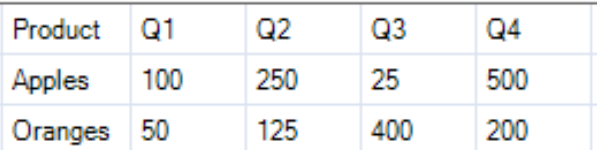
An example dataset to show how this works is shown below, which shows regional sales for each quarter.
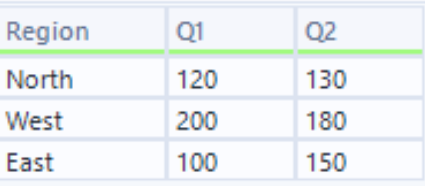
To make the data easier for people to read in this scenario, we want to pivot the data to create the following output:
When the Cross-Tab tool is selected, you will see the following:
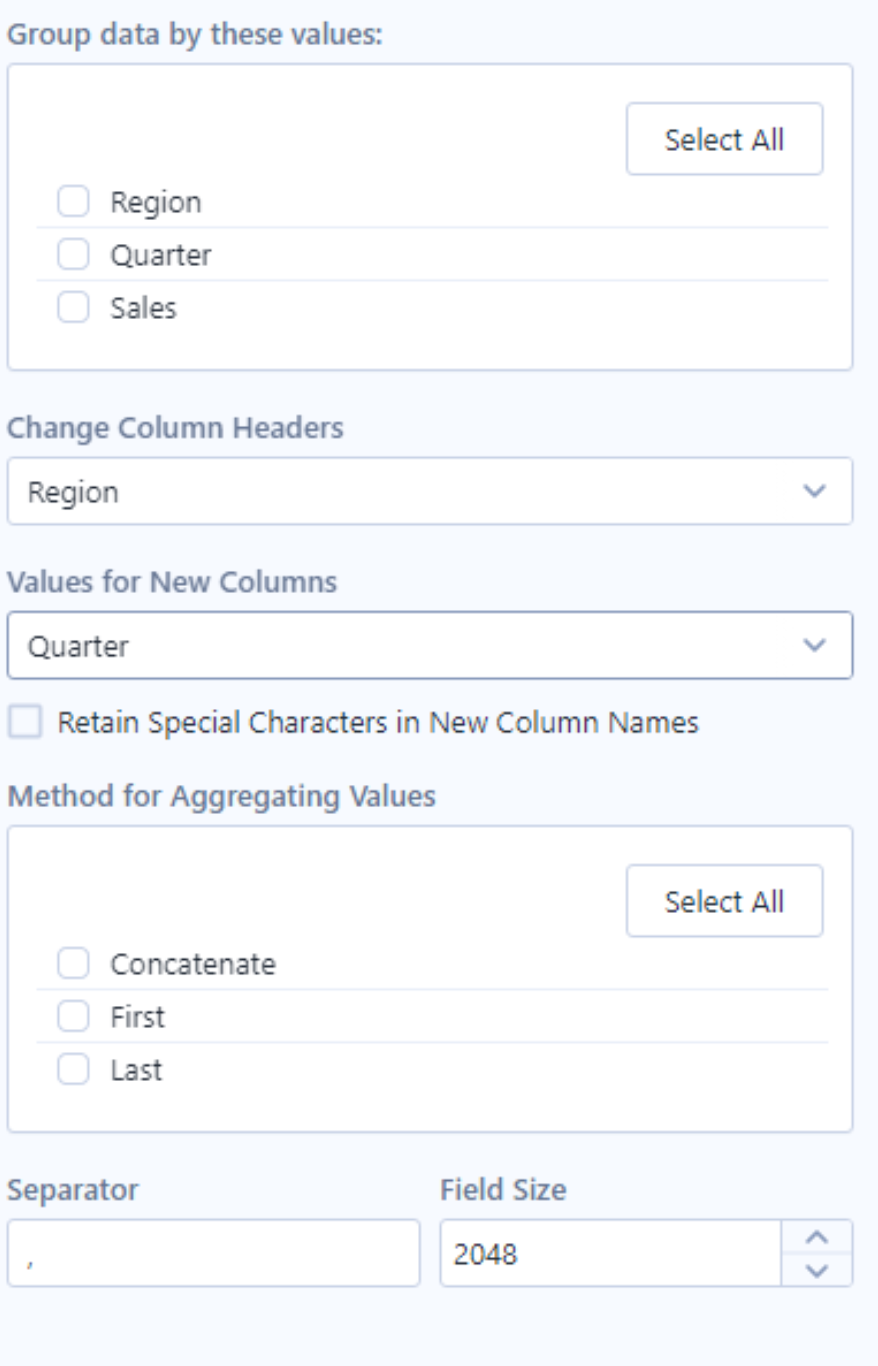
Group Data by these values:
This will always contain a checklist of fields from the connected dataset.
Fields that are ticked will NOT be pivoted into new columns. In other words, ticked fields will stay the same. When selected, this field will also determine the number of rows that appear in the output.
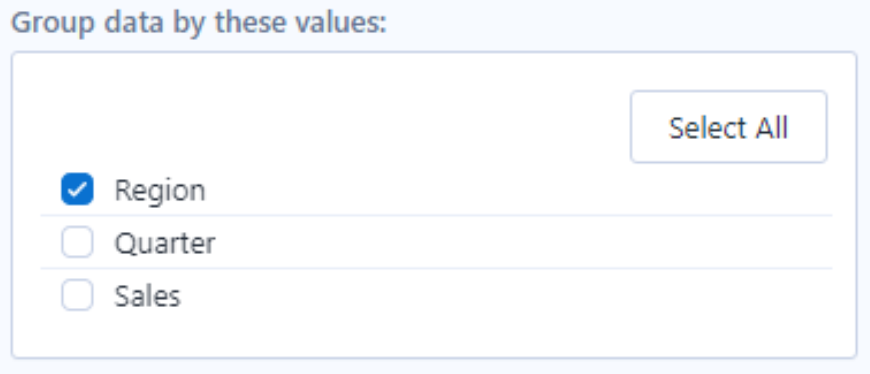
In this instance, we want to keep the regions as rows, so this will be ticked:
Change Column Headers:
This is the field you want to pivot into columns. As we want to better compare Q1 and Q2, we will select this field so each unique value in the field will become a new column.

Values for New Columns:
This is essentially the field that you wish to "fill in" your newly created fields with. As we want to see quarterly sales, we will select the Sales field here.

Method for Aggregating Values
This defines how you want your data to get filled in to the new fields. The options you see are dependent on the data type of the field selected in "Values for New Columns".
As Sales are a numeric data type, the options are as follows:
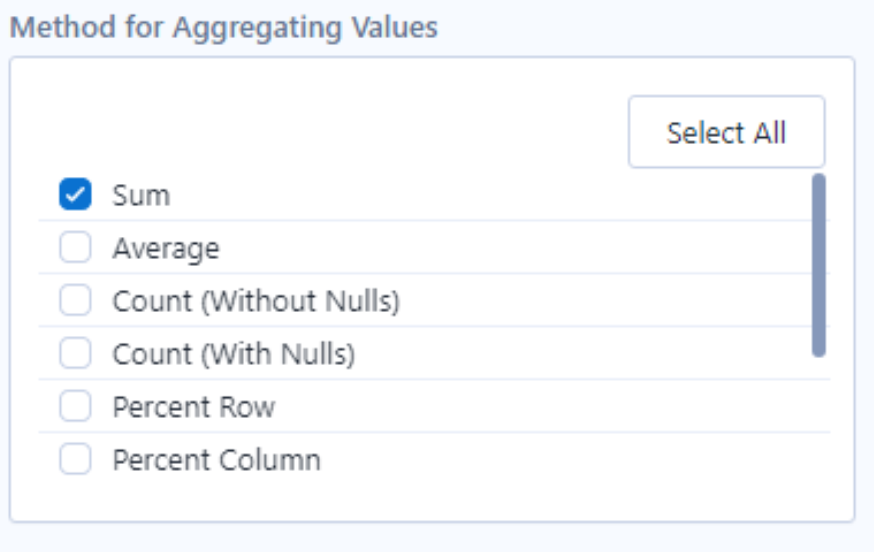
As we want to see the total sales for each quarter and region, Sum has been ticked.
Now, you can press run and you should get the correct output.
NOTE: For fields not involved in the pivot, if they aren't selected in the Group By checklist, they will not appear in the final output.
Transpose

TRANSPOSE - AKA Unpivot, or Columns-to-Rows Pivot (transforming wide data into long data)
To show how this tool works, the input data I am using looks at quarterly sales of fruits:
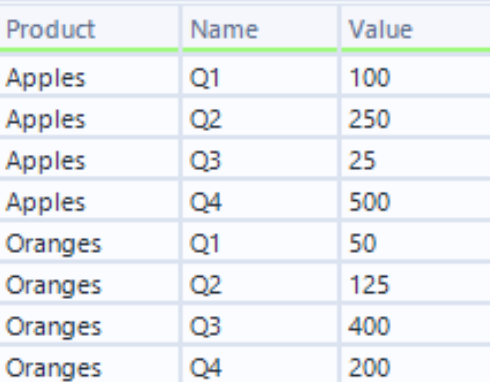
To make it easier to visualise the data, the quarterly periods should be unpivoted into one field with corresponding sales values, as follows:
When the inputted data is connected to the transpose tool, the following configuration appears:
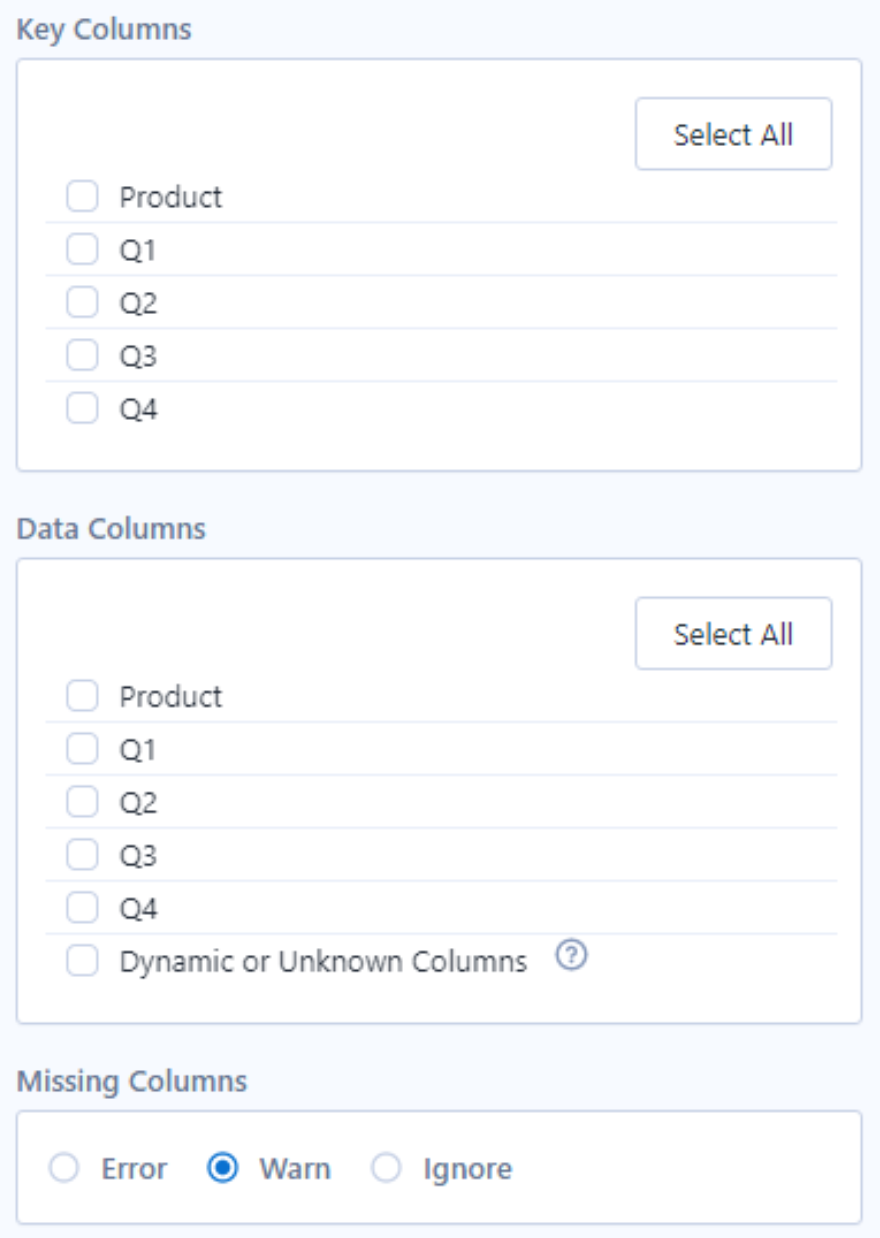
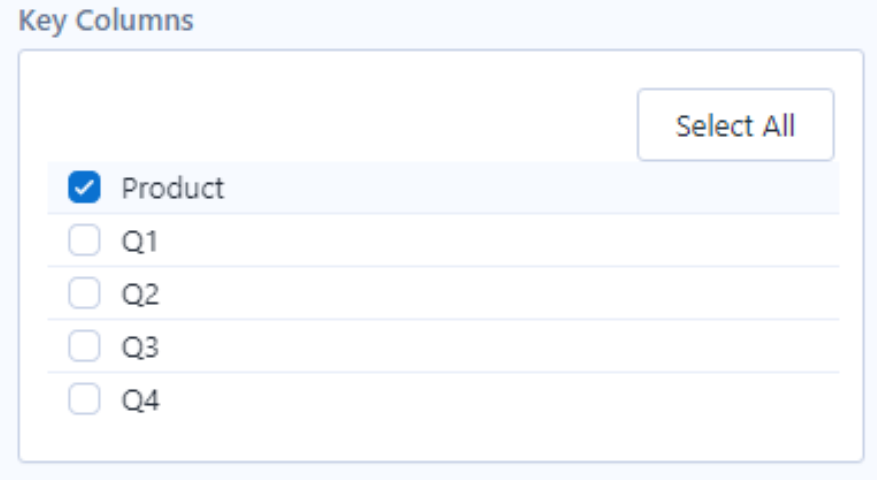
Key Columns
This appears as a checklist of all fields in your dataset. The fields that are ticked here are the ones that you want to keep the same. In other words, these are the fields that will remain in their current shape. As we want our product types to stay within their rows, this will be ticked:
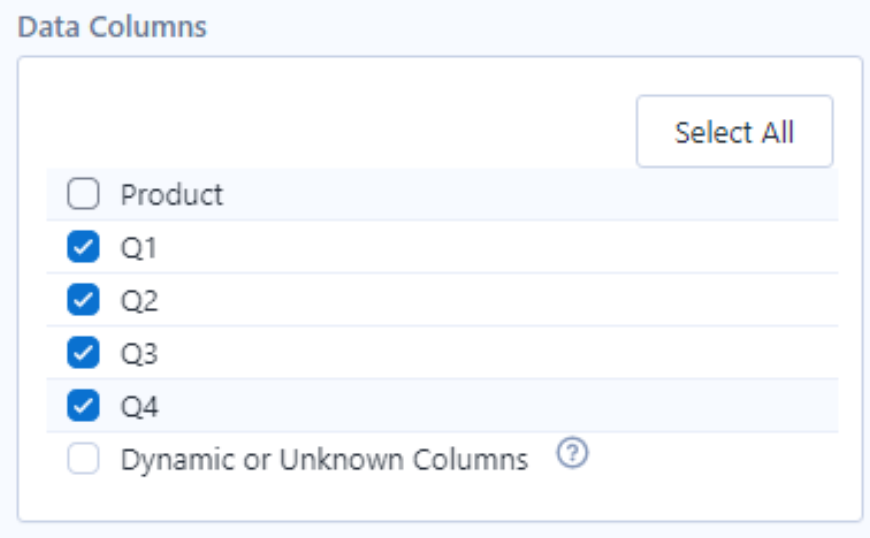
Data Columns
Presented as another checklist, ticked fields in this section are the ones that you want to unpivot into rows. It should be noted here that the fields selected here will all unpivot into the same field. (Therefore, if you have multiple fields that you want to unpivot into different columns, this should be done in separate transpose steps).
In this case, as we want our different quarters to sit within the same fields, these will all be ticked:
Once run, we will get the following output, matching what we desired: