


Cardinality is the relationship between rows of data in separate tables within a data model. Its vital for determining how many times a value appears in a table and whether values are unique.
There are four types of cardinality which may be encountered in Power BI (and elsewhere):
- Many to one
- One to one
- One to many
- Many to many
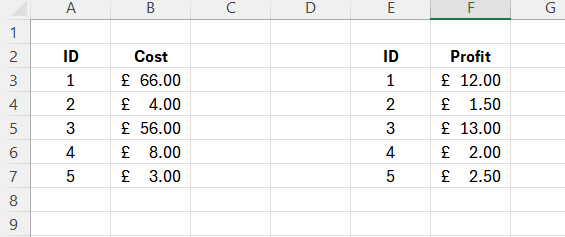
One to one relationship
This is probably the easiest type to conceptualise. Suppose we have two tables within our data model and have an 'ID' column in both. If each row is a unique ID and both tables contain the same ID values then we can join these tables via a one to one relationship. In other words every unique ID will match with itself exactly once. See figure 1 below:
One to many and many to one relationships
Slightly more difficult to conceptualise than a one to one relationship are one to many (and vice versa) relationships. These arise when for a particular field in one table each row is unique whereas in another table they are not. Consider the following example within the context of sales in figures 2 and 3.
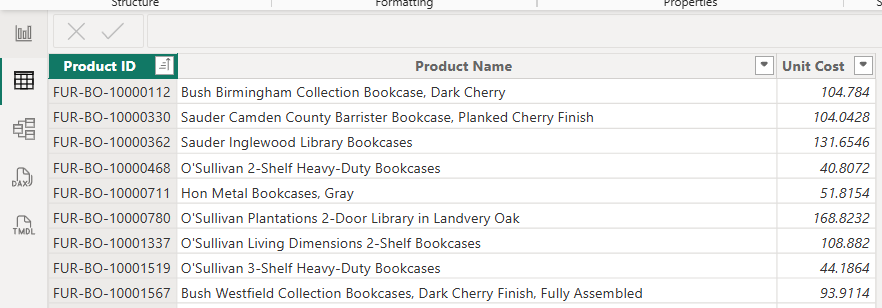
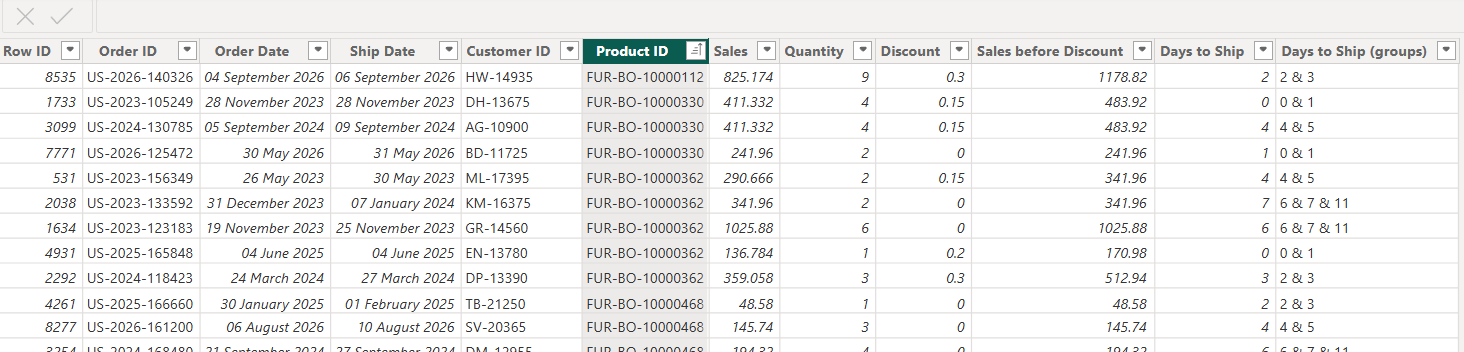
The product ID field in figure 2 is unique to each row whereas in figure 3 it is not. Figure 3 in this example is acting as the fact table (and thus most granular) and figure 2 as a dimension table. The 'many' part of this relationship is always from the fact table.
Many to many relationships
A many to many relationship is arguably the most complex. They arise when multiple records in one table relate to multiple records in another table. A good example is within the context of bank accounts and bank customers. A customer can have multiple bank accounts and a bank account can have multiple customers (i.e. a joint account). When creating a data model with a many to many relationship, a third table is required which relates the two. It sometimes has the rather trivial name of a factless fact table and each row within it would be a customer-account association in this example.
Relationships within Power BI
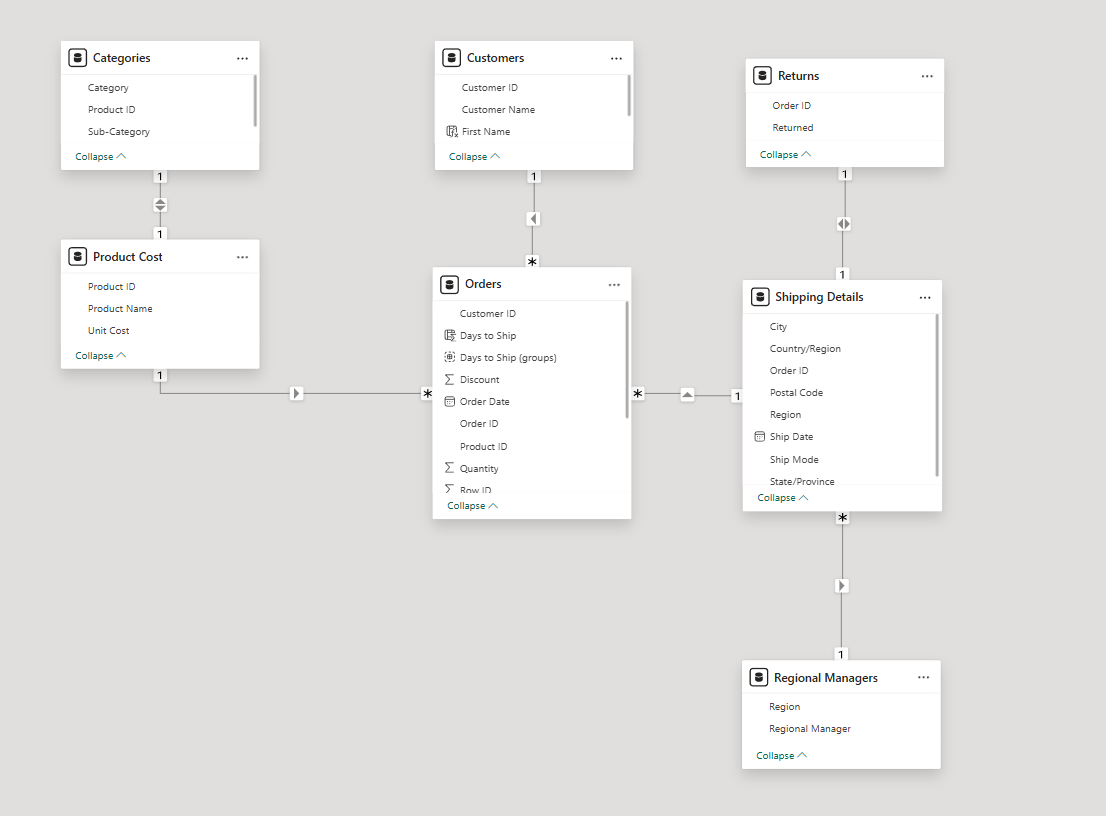
Making relationships within Power BI is a simple procedure and can be done in the model view. In this view you can drag fields between tables and pick the correct cardinality. Power BI will pick a cardinality it thinks is suitable from a data sense but this may not make 'human' sense. Figure 4 shows an example of a data model. The * symbol denotes a 'many' relationship and the '1' is self explanatory! The arrows on the noodles are cross filter directions and indicate the direction in which filtering between tables can be applied (but that is a topic for another blog).
Hopefully this blog has provided a concise insight into cardinality and will help ensure that data models are correct and realistic!