One of the first things you will need to do when working with data is clean it. That is, making sure that it follows these rules:
- 1 data field per category/measure
- 1 data type for each data field
- 1 date column where possible (not one each for day, month and year)
- Multiple columns allowed if they are different metrics e.g. order date and ship date
- 1 row should be a record containing all the values in each data field possible
These rules should be followed most of the time, but as always, this depends on what you're doing with the data.
Creating a data preparation plan will help us get the data from its original state to one which follows these rules. It will also help us to quickly clean the data in Tableau Prep (or whatever tool you want to use) as we will already know the steps to take, and help us to identify any errors with the cleaning later along the line.
Stage 1:
The first stage is to understand who the client is, what the client is trying to achieve with the data and who is going to be using the dataset. This will help us understand what data needs to be shown and how to present it.
In my example, our client is a sales and marketing executive for a hospitality company which has newly acquired 3 hotels.
Stage 2:
The second stage is to look at the raw datasets and understand the granularity of it - this means what happens to create a new row/record in the dataset. Once you know the granularity you will be able to see if and how the datasets can be combined.
In the example, the granularity of the 3 reservations datasets (one for each hotel) is the reservation ID (each reservation creates a new row). The granularity of the Transactions dataset is the Transaction ID (each transaction creates a new row). The granularity of the Hospitality Lookup dataset is the code for either the department, room type or booking channel (each code creates a new row telling us what the code means in words).
This tells us that we can create a union between the 3 reservation datasets since the same thing happens to create a new record in each dataset.
Stage 3:
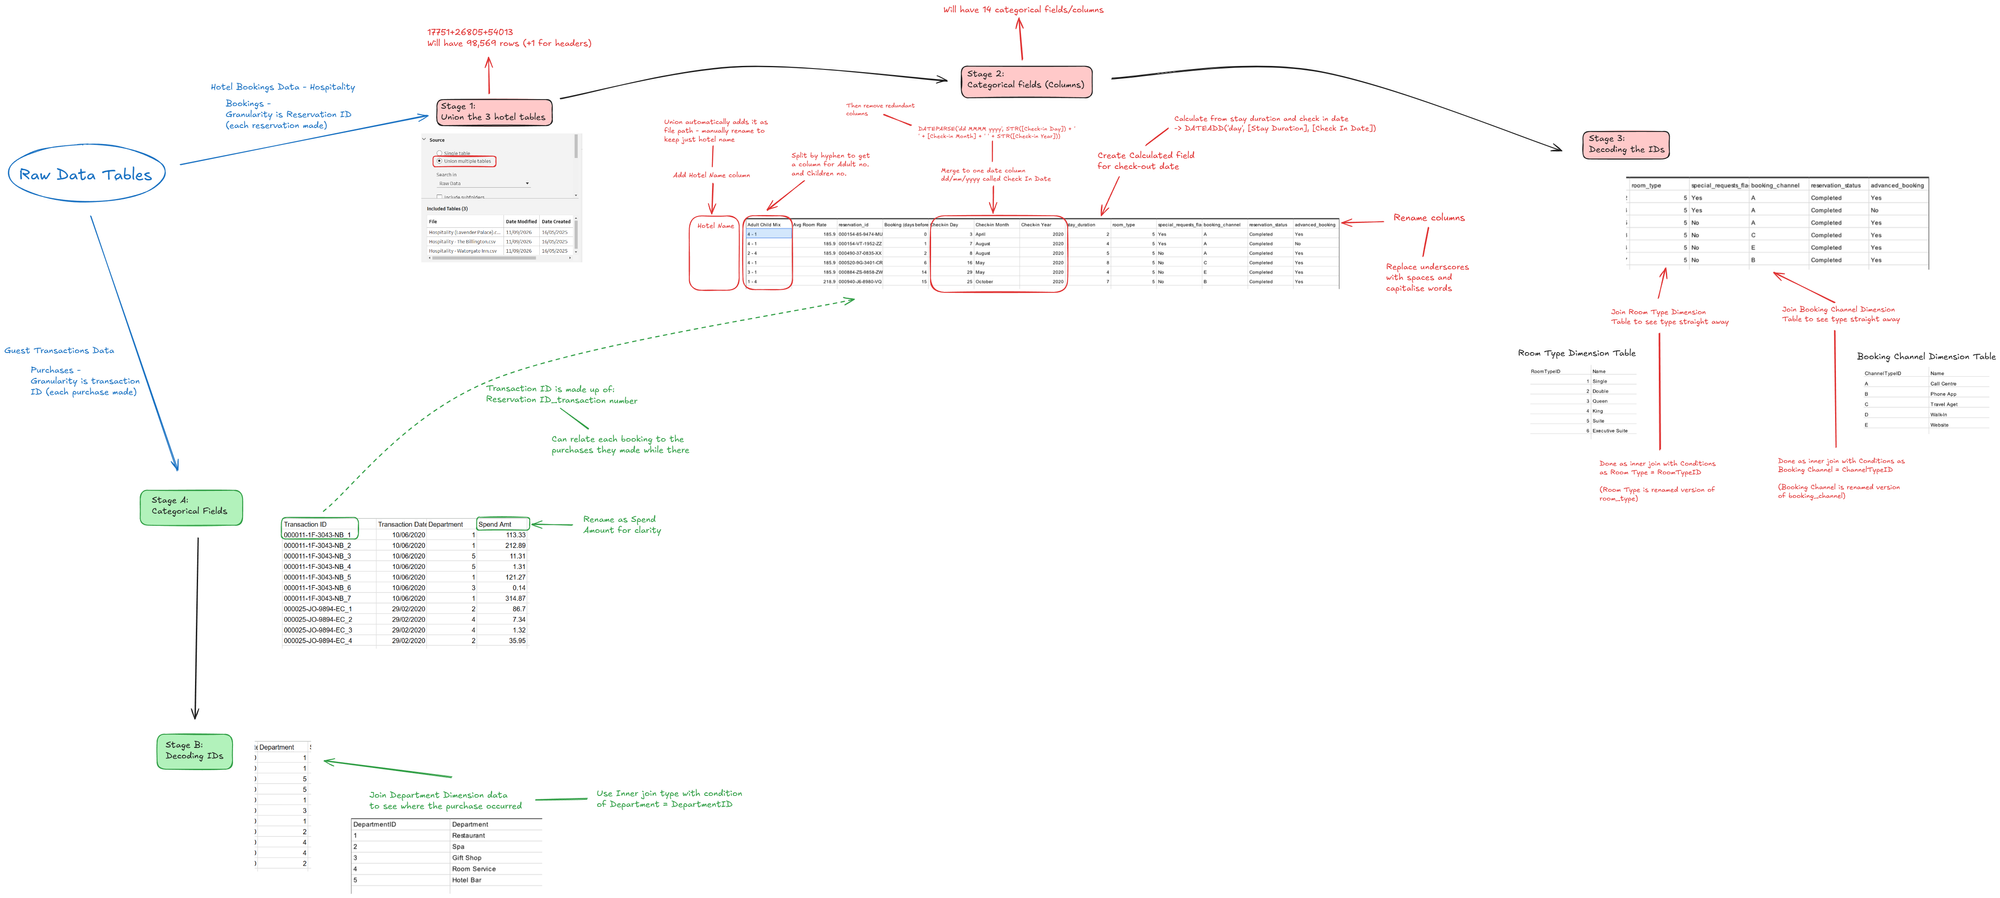
The third stage is to look at the categorical fields (columns) in each dataset (or dataset group) and identify what columns you want to end up with. Always refer back to your brief or user objectives to decide the final columns and write these down. I like to upload a screenshot of the original dataset with the headers to Excalidraw and write my desired columns next to this.
Stage 4:
In this stage, you need to identify what you need to do to get to your desired columns. For example, merging columns, splitting a column, joining a new dataset, creating a calculated field. It is important to document this clearly so that when it gets to creating the flow you know exactly what to do - it really speeds up the process.
In this example, one of the columns I wanted was Check-out date. I didn't have this column so I identified that I would have to create a calculated field for it. I noted down how I would have to use the calculation DATEADD('day', [Stay Duration], [check In Date]) to get this.
Stage 5:
Finally, use colour coding or numbering to split your plan into separate parts. Having a clear system helps you to understand your plan easily and quickly, letting you know what needs to be done to what data and when.
In my example, I used colour coding to show what changes needed to be made to each data set group.