Today is the final day of dashboard week, which means it is the final day of training for DSNY11! It has been an incredible journey and today's dashboard task definitely felt like a culmination of a lot of the work that we have been doing throughout the past four months. To be more specific, today's task was to take the list of New York State heritage sites, given here, identify their latitudes and longitudes in a form that would be ready for visualization, pull in another dataset to enhance the insights from that original set of points, and come up with an analysis centered around helping to plan a hike.
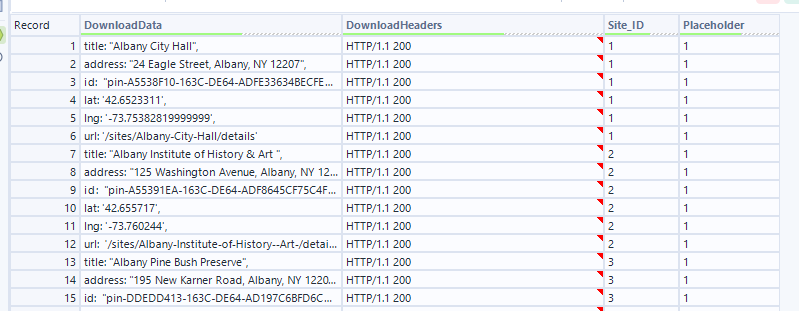
To obtain the necessary points, I used webscraping in alteryx, chanining together the text input tool (with URLs input) with the download tool to scrape the entirety of the pages that list the heritage sites. From there it was an html parsing game, using the text to rows configuration of the text to columns tool to break the dense html out into rows, then searching for instances of useful information such as "title", "latitude", and "longitude". Once I had those values in individual rows, I used a cool alteryx / data prep trick! I introduced a placeholder field called "1", which always contained the number one, then used it as my column header for the result of a cross-tab.
Here is the before data,
and here is the after:
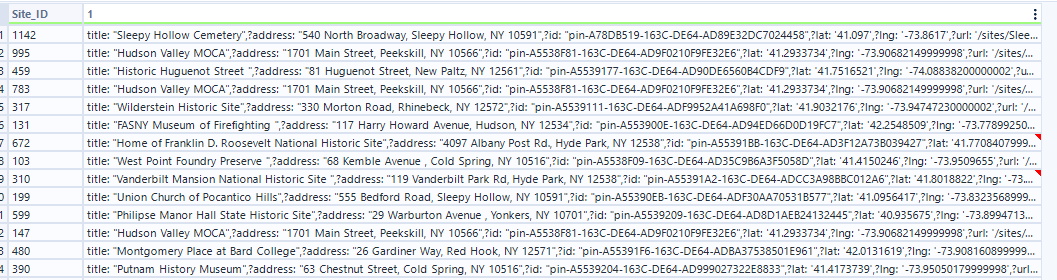
Using concatenation as my method of aggregation in the crosstab allowed me to bunch all of this valuable information together, to then separate out using another text to columns later.
Another interesting part of my process was dealing with all of the extra characters present in this original information – things like "title: ", and all of the different types of quotes. To clean up this data, I strung together a series of very similar regular expression tools, all with formulas that were some variation of the following:
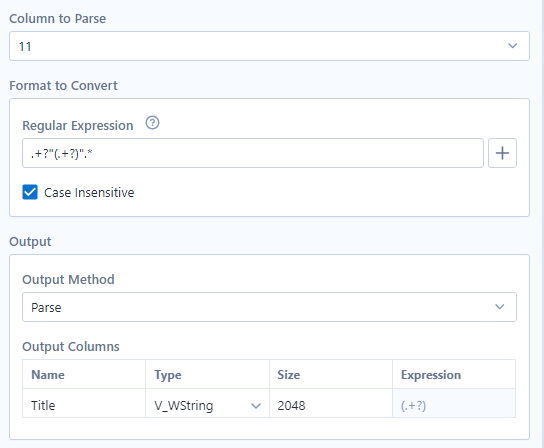
This expression looks to keep everything from after the first instance of a double quote, to right before the next instance of a double quote, which successfully captured all the useful information.
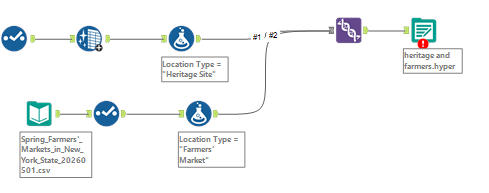
To supplement my analysis, I decided to grab some information about locations of Farmers Markets and when they were open! For ease of visualization, I decided to union this data in with the other, altering the fields within to closely match the original, adding a field called location type to distinguish which data came from which original table, and using the union tool in Alteryx.
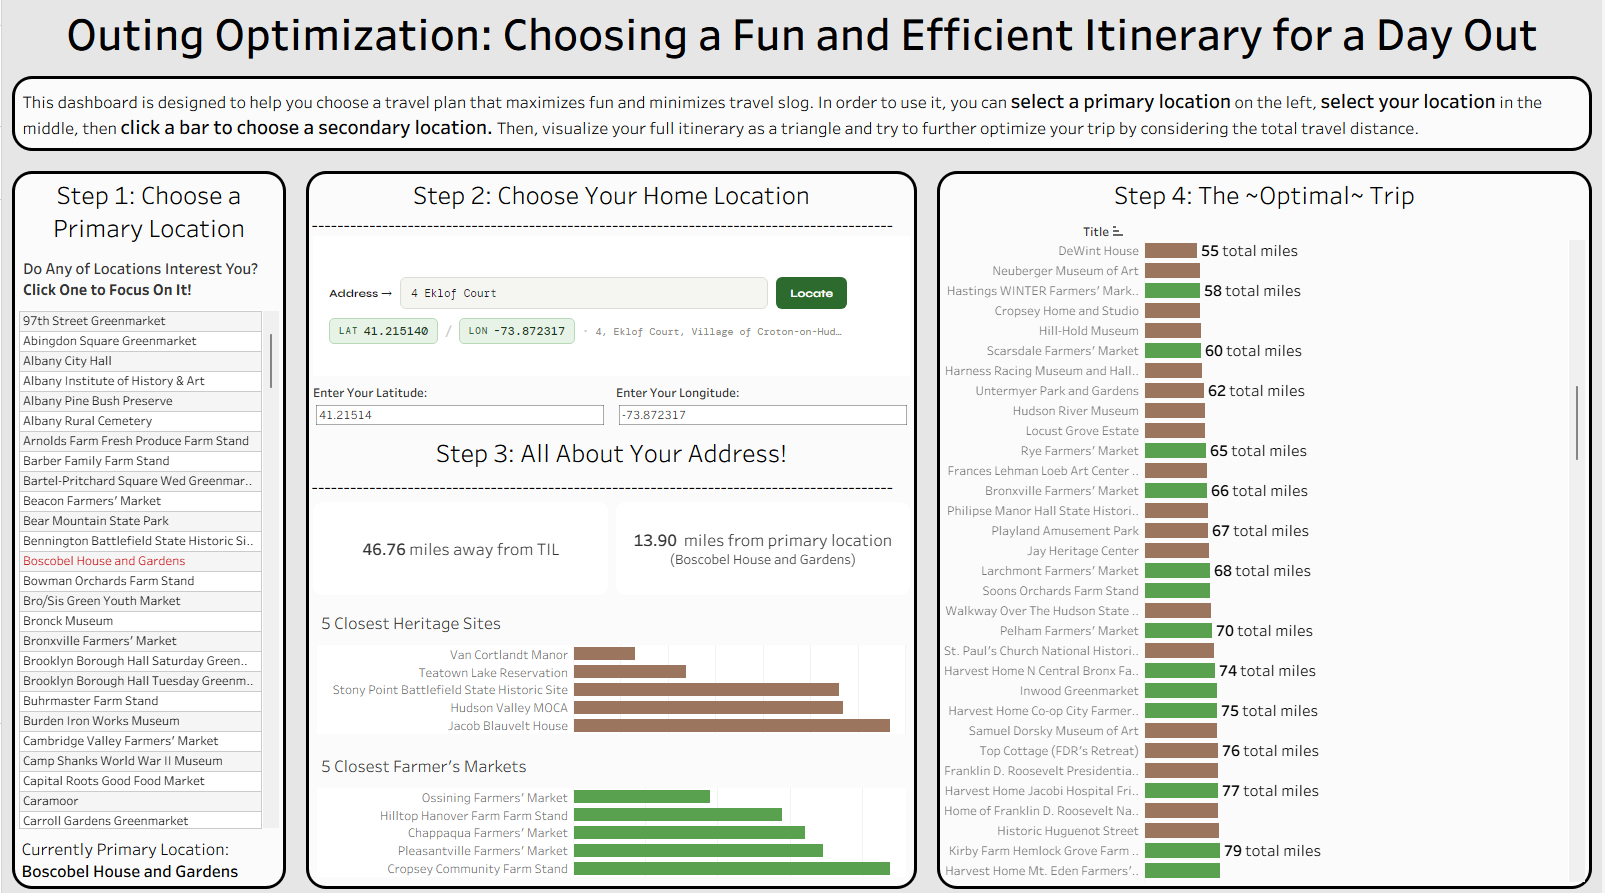
In the end, I built a Tableau dashboard that can be used as a tool to optimize a trip based on your own location, a primary location that you want to visit, and possible secondary locations that you can add on. You can find it on my Tableau Public, or see the screenshot of an in-progress version below. It has been a pleasure writing blogs during training and I hope to write many more after. Thank you for reading!