


When working with data in Tableau, it's common to need to compare values. But what if you want to compare a value to the one right before it, or to the very first value in the set? This is where Table Calculations come in, and understanding how to use Previous and First can unlock a new layer of insight in your visualisations.
What are they?
Tableau's definition: A table calculation is a transformation you apply to the values in a visualisation. Table calculations are a special type of calculated field that computes on the local data in Tableau. They are calculated based on what is currently in the visualisation and do not consider any measures or dimensions that are filtered out of the visualization.
Why Use Previous and First?
The difference between Previous and First lies in their point of comparison.
- Difference from Previous: This calculation determines the difference between the current value and the value immediately preceding it. This is ideal for analysing trends such as month-over-month growth, sequential changes in sales, or any other series where you need to see how each data point compares to the one that came before it. For example, if you have monthly sales data, a "difference from previous" calculation would tell you how much sales changed from January to February, February to March, and so on.
- Difference from First: This calculation determines the difference between the current value and the very first value in the series. This is ideal for tracking overall progress or deviation from a starting point. For instance, you could use this to track how a new product's sales have grown since its launch date or how the number of active users has changed relative to the beginning of the year.
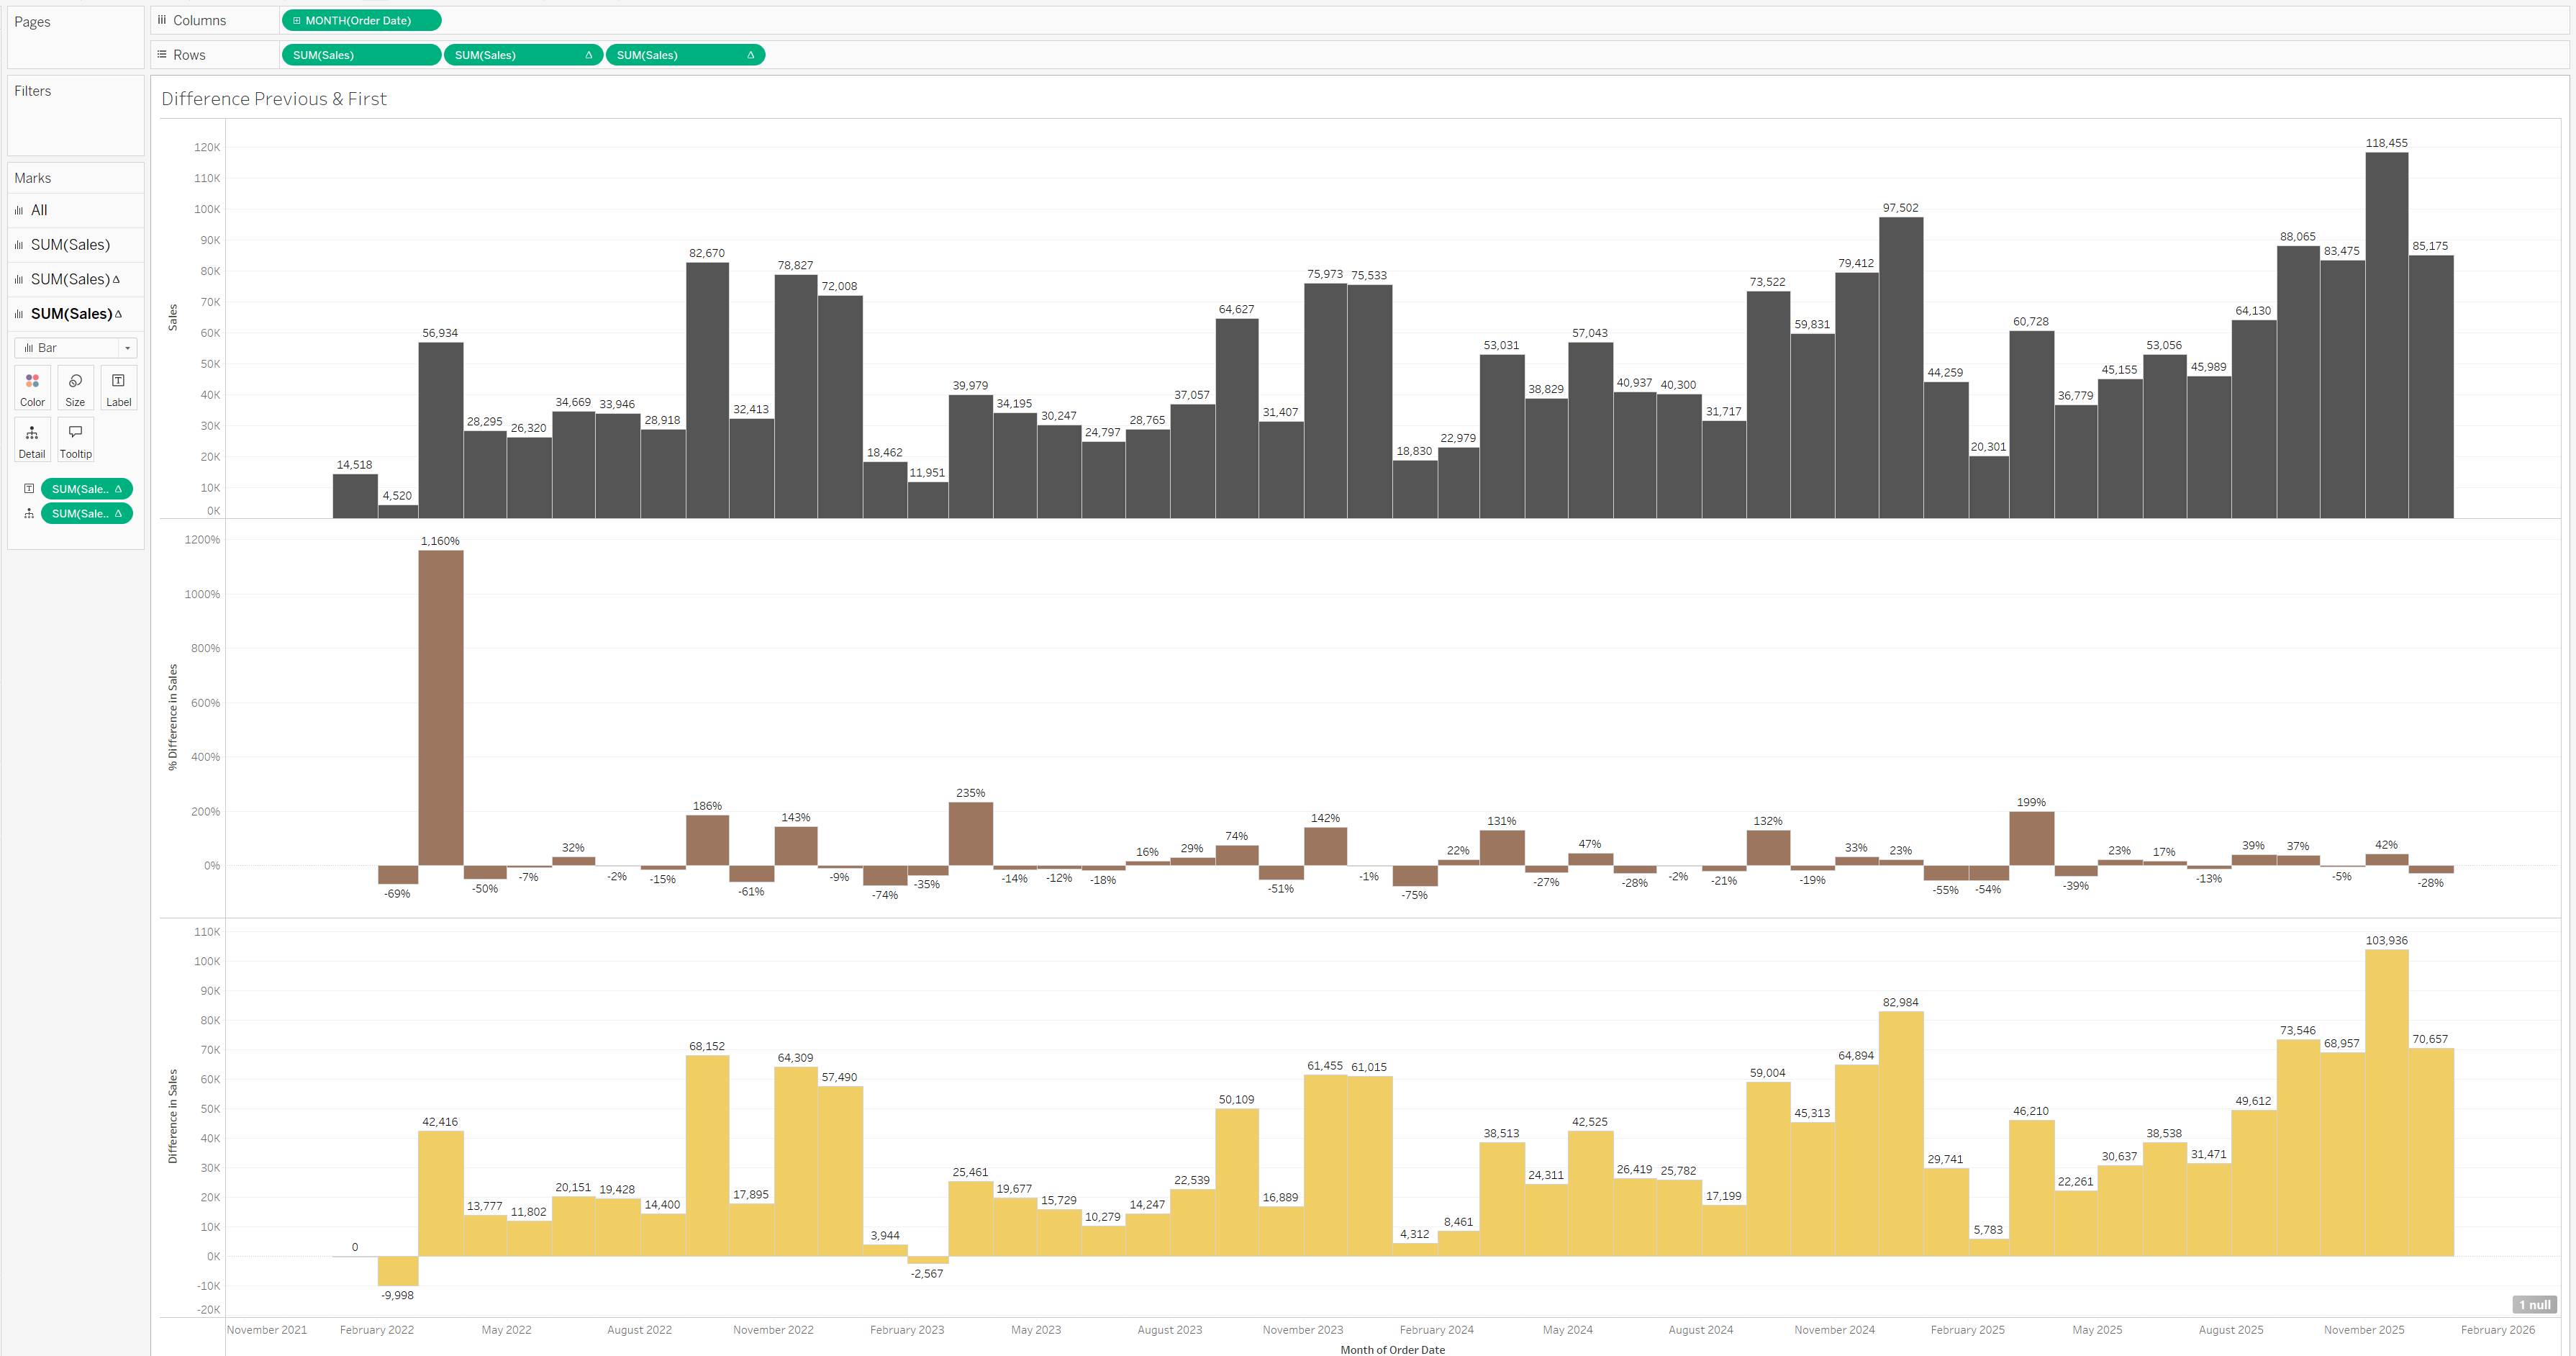
For instance, the chart above shows monthly sales (dark grey). The following charts apply a table calculation to visualise the differences. The first visual (brown) shows the percentage difference from the previous month's sales, providing a clear view of month-over-month performance. The second visual (yellow) shows the total difference from the first month's sales, highlighting cumulative growth from the start of the period.
How to Do This in Tableau
1.Set Up Measure Values: In a visualisation, such as a table, place the measure being analysed on the Rows or Columns shelf.
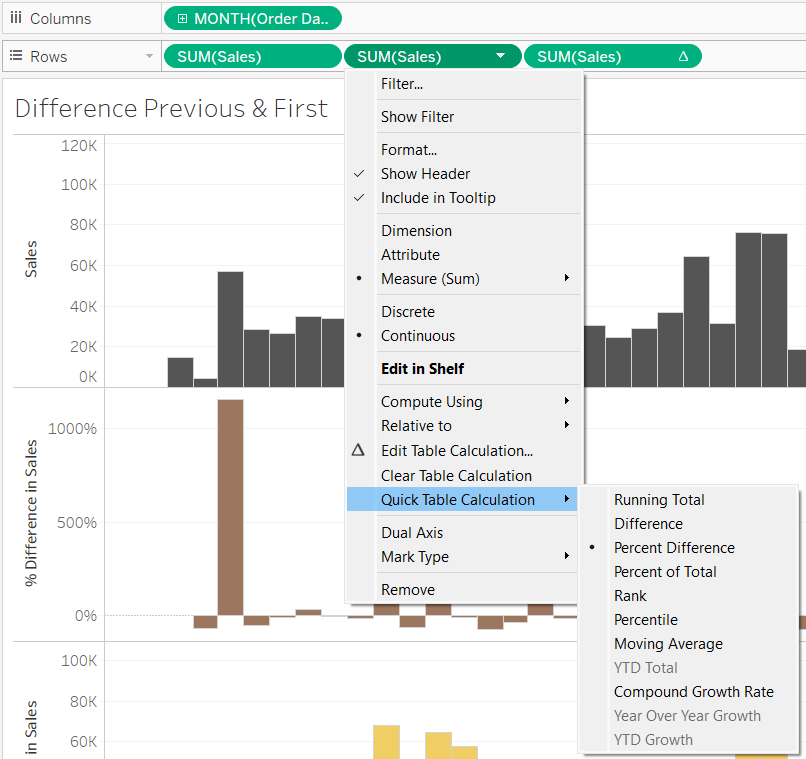
2.Apply a Quick Table Calculation: Right-click on the measure in the view, navigate to Quick Table Calculation, and select the relevant calculation (Percent Difference is used in this example).
3.Edit the Calculation: To specify the Previous or First comparison, right-click on the measure again and select Edit Table Calculation. A window will open, allowing you to customise the calculation.
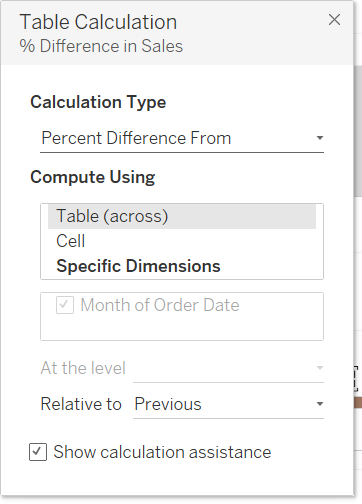
4.Define the Comparison: Under the "Compute using" section, you can select how you want the calculation to run (e.g., across the table, down the table). Crucially, for a Difference calculation, you will see a section where you can specify Relative to. Here, you can select either Previous, First, Next or Last to get the desired result.