Task
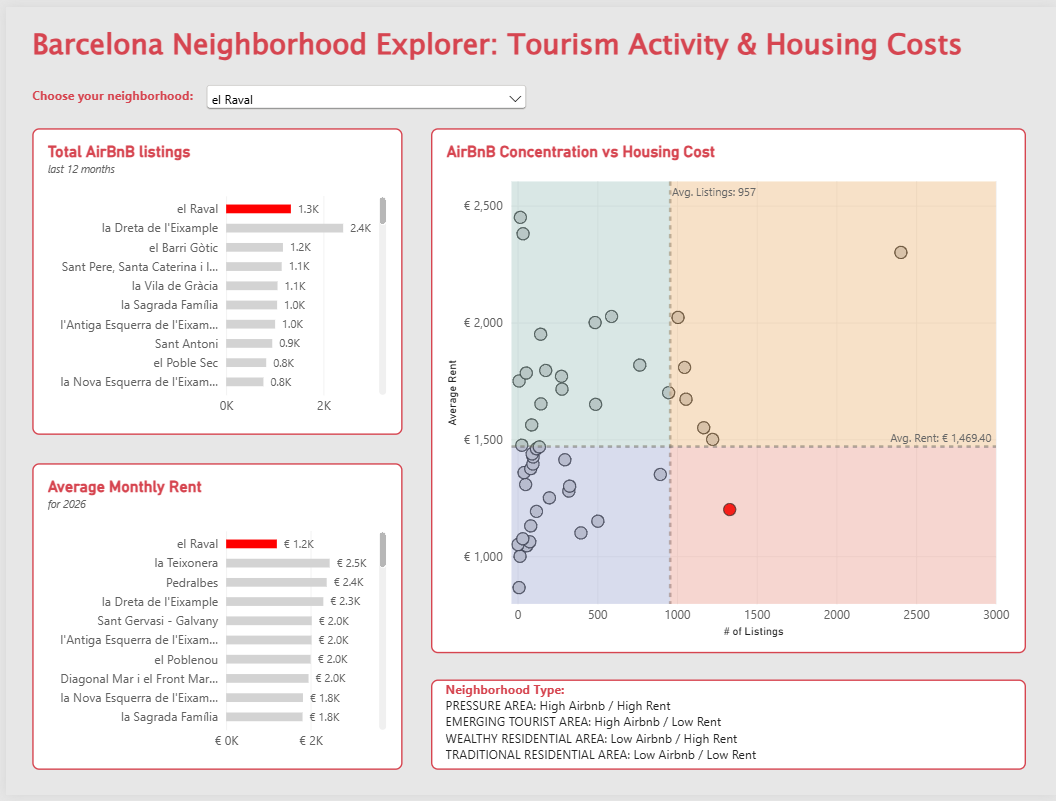
Today’s task focused on designing a Power BI dashboard analyzing Airbnb activity. I decided to look at data across Barcelona neighborhoods. The goal was to explore how short-term rental activity varies throughout the city and investigate potential relationships between Airbnb concentration and housing costs.
My Plan/Completed Work
I started by defining a clear user story centered around a housing policy analyst who wants to understand how Airbnb activity varies across Barcelona neighborhoods and whether areas with higher tourism activity also experience higher housing costs. From there, I designed a dashboard that would allow users to select a neighborhood, view its relative ranking in Airbnb listings and rental prices, and analyze how it compares to other neighborhoods. The dashboard structure was built around two ranking visualizations and a quadrant analysis that classifies neighborhoods into distinct categories based on Airbnb activity and housing affordability.