


Level of Detail Calculations are one of Tableau’s most powerful tools. They allow an analyst to set a particular level of aggregation for a measure, and to fix that level of aggregation in a calculated field for later use. The value of the field for each row depends upon the aggregated section to which it belongs. For example, if we were setting the level of aggregation to Region, then all of the rows for which the region was ‘West’ would have the same value for the LOD.
The syntax for an LOD is a set of curly braces, containing first the kind of LOD calculation you want to perform (FIXED, INCLUDE or EXCLUDE), followed by the dimension(s) you want to aggregate to the level of. After that, type a colon, followed by any aggregate expression.
For example:
{ FIXED [Region] : SUM([Sales]) }
This calculation would return the sum of sales for each region. Admittedly, this particular calculation is not particularly useful, since the level of aggregation is so large, but it illustrates the point.
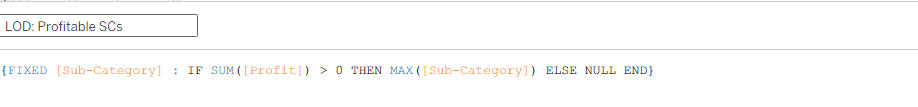
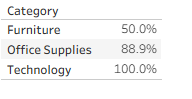
Let’s dig into LODs a little more with a use case. Suppose that you wanted to calculate the percentage of each category’s sub-categories which have positive profit. This could be accomplished by creating three calculations. The first is an LOD calculation which, fixed on Sub-Category, returns the name of the Sub-Category if the sum of sales is greater than 0, and is Null otherwise.
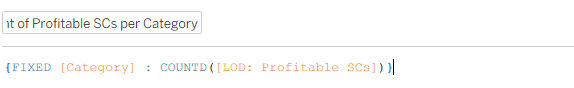
The second is another LOD, this time fixed on Category, which counts the number of distinct values in the previous LOD. In effect, this will return the number of sub-categories in each category which have positive profit.
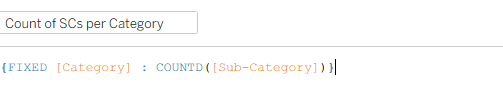
The third calculation is the same as the previous one, except counting the number of distinct sub-categories in general for each category, rather than just the number of sub-categories with positive profit.
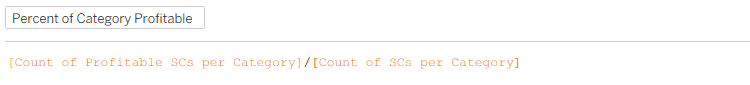
Finally, we divide the second calculation by the third one and set the number type to ‘percentage’ in the Formatting pane, to get our desired result.
The versatility of LODs cannot be overstated, and they should be an essential part of any Tableau analyst’s arsenal. But up to this point I have only discussed FIXED LODs. What about the other two varieties mentioned above: INCLUDE and EXCLUDE? In short, these two are not nearly as widely used as their FIXED counterpart, in large part because their functionality can be accomplished through other avenues. But they do have some fringe uses, and understanding how they work may help to consolidate your understanding of FIXED LODs.
The INCLUDE LOD function allows the user to set particular dimensions to always be taken into consideration when aggregating, even if they are not in the view. This is different from FIXED, however, since the level of aggregation for the calculation may still vary depending on what dimensions are in the view.
The EXCLUDE LOD, on the other hand, does exactly the opposite - setting certain dimensions which will never be taken into account when aggregating, regardless of whether they are in the view or not.
In conclusion, LODs, particularly FIXED LODs, are an extremely powerful kind of calculated field in Tableau which allows the user to determine exactly how they want to aggregate their data, independently of the fields which they might have in the view. If you want to try and push yourself, open up Tableau Superstore and see if you can use LODs to calculate a few of the following:
- What is the city in each region with the highest Sales? Highlight this city on a map.
- Create a bar chart of Sales over the last year which uses color to flag any month which is more than 20% below the all-time average for that month.
- Create a monthly step-line chart, broken up by segment, measuring the percentage of sub-categories which had sales over $3000