


Suppose you’ve just spent the last engineering an elegant Alteryx flow which cleans and aggregates data from several sheets before joining them together. Your stakeholder, delighted as they are by your work, asks for the data to be output into a format which they can show to their colleges to quickly summarise your insights. One could, of course, output the data into a different software - say, Excel or Tableau - and use that software to quickly format the data to meet the stakeholder’s needs. But this method is rather slow, and might lack future-proofing depending on how the systems are set up. Fortunately for you, Alteryx offers a range of in-house tools to allow users to quickly generate, format and automate reporting. Behold - The Reporting Tools.
To access these tools, navigate to the top of the screen and click on the orange paper icon next to word ‘Reporting’ to open the Reporting tools palette. There are thirteen total reporting tools available, however many of these perform similar functions. In general, most of the reporting tools will add or modify some aspect of a data report. This report will be built up using reporting snippets - little pieces of formatting instructions - which can then be read alongside your data and transformed into PDF, HTML, XLSX or DOCX using the ‘Render’ tool.
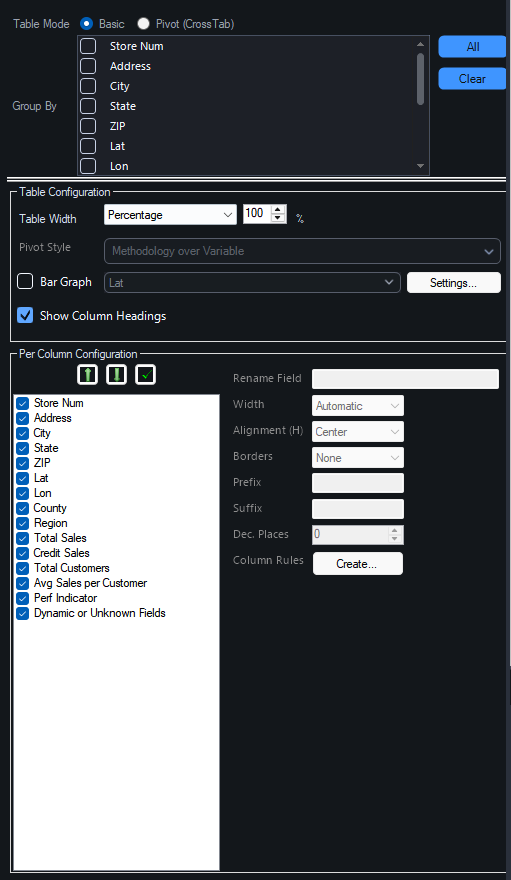
The most basic tool you will use is the Table tool, found on the far right hand side of the palette. In the first level, this gives you two options: Basic or Pivot table. These are largely the same, but the Pivot option should be chosen if you had previously used a Cross-Tab tool. It will provide you with a few additional formatting options in this case. No matter which option you choose here, you will be able to choose which data with which to populate the table and format it. One of the most powerful features in this tool is the ‘Column Rule’, which allows you to quickly adjust an entire column of data at once.
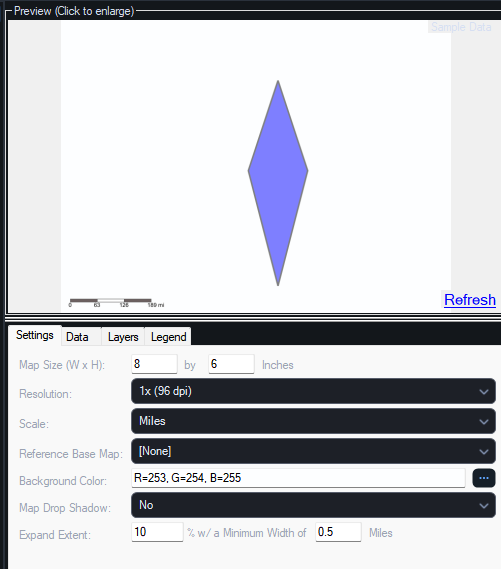
But suppose that a table doesn’t quite capture the insights from your data in the best way. Fortunately, Alteryx also offers tools which allow you to present data in other formats. The Report Map tool, for example, can read geographical data and format it into a map, similarly to Tableau’s same function. This is potentially the most dense of the tools in this pallet, and certainly caused me the most heartache when I first attempted to use it. For the sake of time, I will briefly summarise the four tabs within the configuration pane. The settings tab allows you to configure the most general features of the map, such as the size of the map, resolution and background color. The data tab lets you select particular fields to color group, color or label by. The layers tab allows you to manage the map’s layers, including the shape of marks, any colors generated by the data tab, the size and width of lines and the style of labels. And finally the legend tab provides options for managing or removing the map’s legend. Admittedly, this tool is incredibly complex, and will likely warrant a blog all of its own at some point.
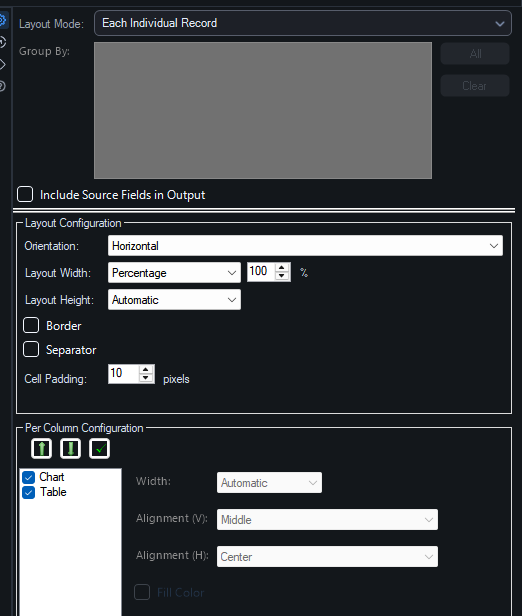
Another essential tool is Layout. The layout tool allows you to arrange and configure the size of different snippets, as well as setting borders and separators. The layout tool is also the only way of configuring your snippets into separate excel spreadsheets, using a ‘section break’. If you choose to export the data to a .docx format instead, this will result in a new page.
Other tools in the palette tend to work around the edges of this ‘core’ set. The Report Header/Footer tools, for example, allow you to add custom headers or footers to the respective areas of your report. The Report Text tool allows you to add titles and subtitles for different sections of the report.
None of these tools are complete, however, without the necessary final stage: the render tool. This tool takes the various snippets you have created and, unsurprisingly, renders them into a document format of your choice. Beyond document types, there are not many configurable settings in this tool. You can set page settings, and adjust the format of PDF outputs, but this tool is really just the final stage after the real work has been done. In that sense, it is broadly analogous to Alteryx’s more common Output Data tool.