


Imagine you walk into your room and your toys are EVERYWHERE. Lego under the bed. One sock on the fan. A dinosaur in the fridge for some reason. That is what raw data looks like. And today, we are going to clean it with clicks!
Things We Can Do During the Cleaning Step 🧼
Removing Unnecessary Data
- Remove unnecessary columns
- Remove duplicate rows
- Remove empty rows
- Remove errors
- Hide unnecessary fields
Renaming & Organizing
- Rename columns/values
- Reorder columns
Handling Missing & Incorrect Data
- Fill missing values
- Remove missing values
- Replace incorrect values
- Check null values
Fixing Data Types & Formats
- Change data types
- Convert text to numbers/dates
- Format percentages correctly
- Standardize units
- Extract year/month from dates
Cleaning Text Data
- Trim extra spaces
- Standardize text formatting
- Fix spelling inconsistencies
- Clean special characters
- Normalize categories
Reshaping Data
- Split columns
- Merge columns
- Unpivot columns
- Pivot data into summaries
- Group categories
Finding Data Issues
- Filter bad or suspicious data
- Detect outliers
- Validate data consistency
- Check relationships between fields
- Sort data
- Filter data
Creating New Fields
- Create calculated columns
Let's explore an example:
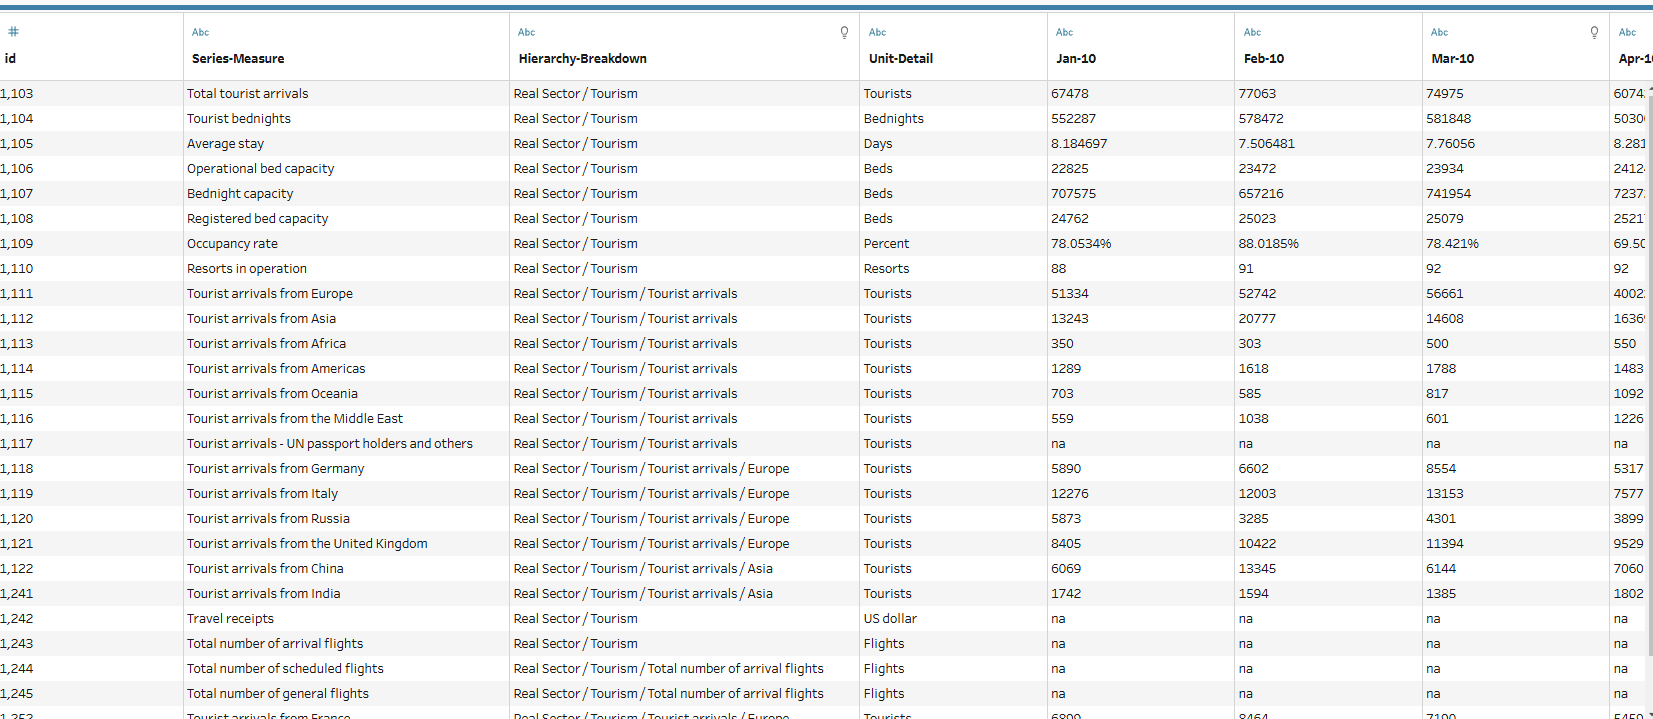
We have a dataset about the beautiful Maldives tourism industry. Now let’s clean it up and prepare it for analysis!
Step 1: Remove the Useless Stuff
Sometimes datasets contain random columns nobody uses. In our Maldives dataset, maybe the 'ID' field is only useful internally. So we simply click: 'Remove Field'.
Step 2: Rename Columns
Some column names are confusing or difficult to understand. We can rename them by double-clicking the column name or using the right-click menu.
| Old Name | Better Name |
|---|---|
| Series-Measure | Tourism Metric |
| Unit-Detail | Unit |
| Jan-10 | January 2010 |
Step 3: Find Missing Values
The n/a values in the dataset represent missing data. Possible reasons: data was not collected/someone forgot/the spreadsheet took a vacation too. You should decide whether you want to remove it, keep it, or replace it depending on the future analysis. We will remove them ('Filter' - 'Null values' - 'Keep only non-null values' or click 'na' field - 'Exclude').
Step 4: Fix Data Types
The values in the month columns look like numbers, but they are actually stored as text (strings). This becomes a problem because computers cannot calculate properly using text values.
To fix this, click:
- Change Type → Number (decimal)
Step 5: Unpivot the Months
Right now your dataset looks like this:
| Metric | Jan | Feb | Mar |
|---|---|---|---|
| Tourist Arrivals | 67478 | 77063 | 74975 |
Humans love this, but computers hate it. So, we use 'Pivot' click to transform columns to rows.
| Metric | Month | Value |
|---|---|---|
| Tourist Arrivals | Jan-10 | 67478 |
| Tourist Arrivals | Feb-10 | 77063 |
Step 6: Filter only UK tourists
This helps us analyze a specific group without distractions from the rest of the dataset.
Click: 'Filter' - 'Selected values' - 'Tourists arrivals from the UK'.
Step 8: Split sectors onto 3 different columns
Some fields contain multiple values combined into one column.
To separate them automatically, click:
Click: 'Split values - 'Automatic split' - 'Use a separator '/''. This creates multiple clean columns from a single combined field. Much easier to analyze. Much less painful to read.
Last step 10: Create output
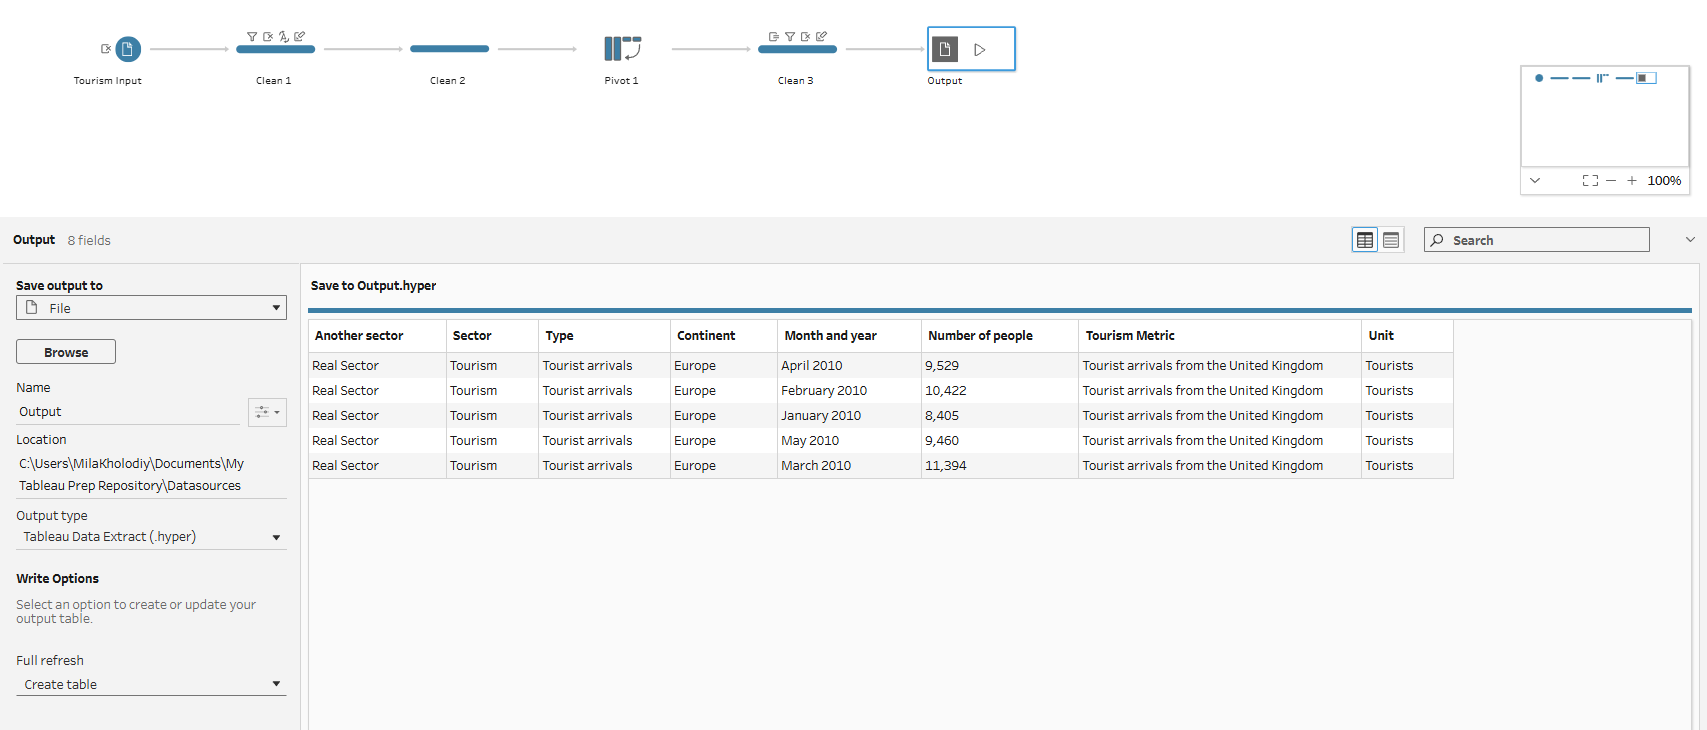
Our dataset is now clean, organized, and ready for analysis. After cleaning the data, we can start building charts, dashboards, and reports to better understand tourism trends in the Maldives.
More links to explore:
1) https://www.tableau.com/learn/articles/what-is-data-cleaning
2) https://www.tableau.com/learn/whitepapers/data-prep-best-practices