


I recently took part in an advanced Tableau Cloud session run by Robbin V., and the goal was a genuinely fun one: build a live connection from Tableau Cloud all the way down to a real database, and then watch a dashboard's targets change on the fly whenever the underlying SQL changed. No re-publishing, no manual refresh — edit the data, and the chart moves.
The end result was a dashboard I called "My amazing car sels". This post walks through how it all fit together — from raw SQL, to a hosted Tableau Cloud site, to a live Bridge connection — and why so much of it happened on a virtual laptop.
Step 1: Building the targets table with SQL in DBeaver
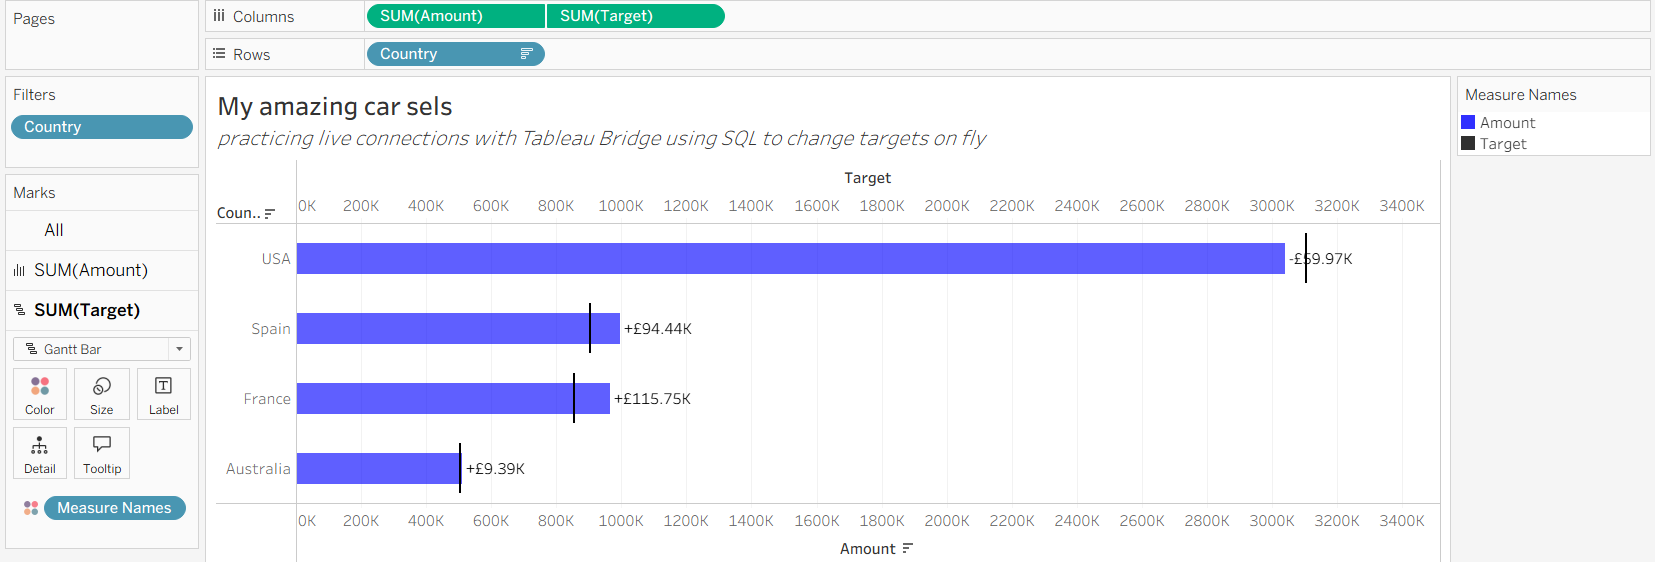
Everything started at the data layer. Using DBeaver connected to an Amazon RDS database (hosted in AWS), I created a table to hold each country's sales target, filled it with values, and then updated those values with plain SQL.
-- Create the table
CREATE TABLE targets_MK (
    Country VARCHAR(50),
    Target  INT
);

INSERT INTO targets_MK (Country, Target)
VALUES
('USA',       2900000),
('Spain',     1000000),
('France',     850000),
('Australia',  500000);

-- Change the targets on the fly
UPDATE targets_MK SET Target = 2100000 WHERE Country = 'USA';
UPDATE targets_MK SET Target =  900000 WHERE Country = 'Spain';
That last block is the whole point of the exercise. Those UPDATE statements — dropping the USA target from 2.9M to 2.1M, and Spain's from 1M to 900K — are what I'd fire off later to make the dashboard react in real time.
Step 2: Creating my own Tableau Cloud site
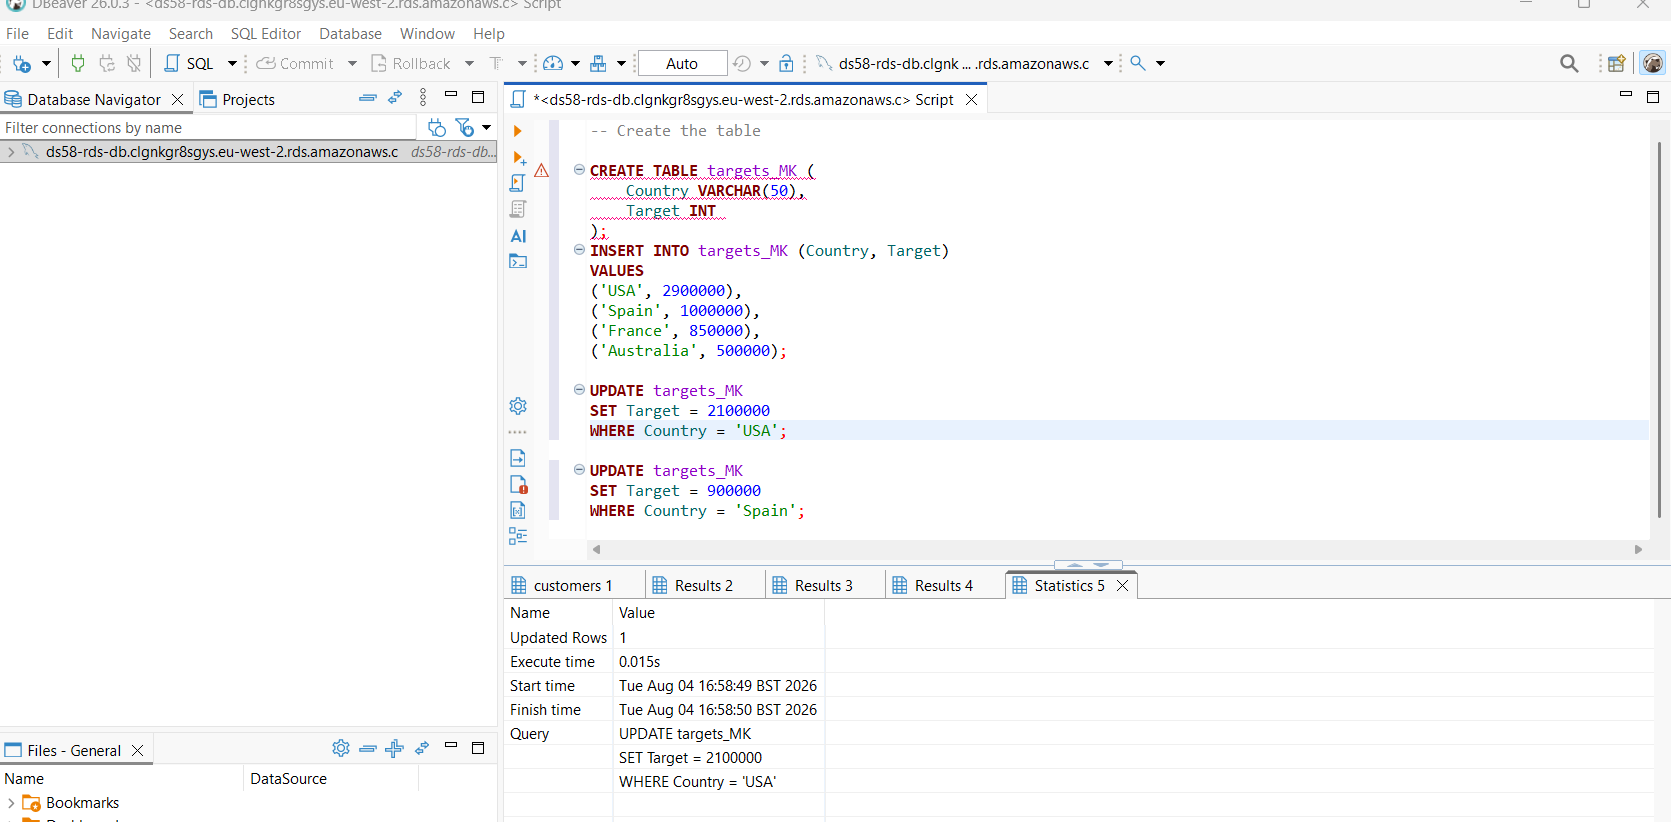
With the data in place, I set up my own site on Tableau Cloud through the Cloud Manager, and named it "Milathebest." A "site" is essentially a walled-off workspace — its own users, permissions, storage, and content, kept separate from everyone else's.
Creating a dedicated site gave the project a clean, governed home to publish into, rather than dumping everything into a shared space.
Step 3: Connecting Tableau Cloud to the database with Tableau Bridge
Here's the piece that makes "live" actually work. Tableau Cloud runs as a hosted service out on the internet, but my database was an RDS instance sitting inside a private network — Cloud can't just reach it directly. That's the job of Tableau Bridge.
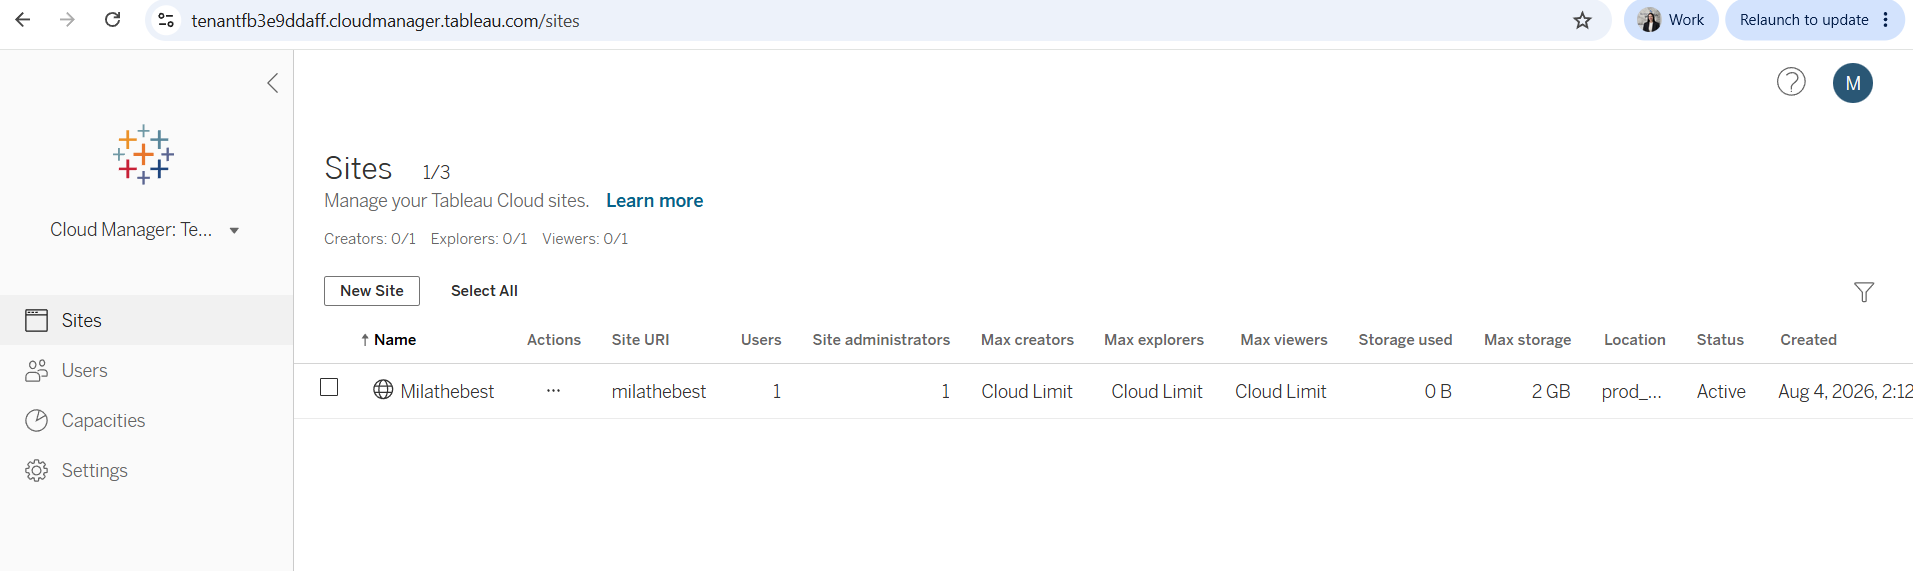
As Tableau's own description puts it, Bridge clients can refresh extracts and maintain live connections to private data. A small Bridge client runs on a machine that can reach the database, and it acts as a secure relay between that database and Tableau Cloud.
In the session I set up a Bridge pool called DS58 to handle those live queries. Tableau Cloud distributes live queries and extract refreshes across the Bridge clients in a pool, so the setup can scale and stay resilient. (In my screenshot the pool shows "Clients offline" — a good reminder that the whole live pipeline depends on that Bridge client actually running.)
Step 4: The payoff — targets that move on the fly
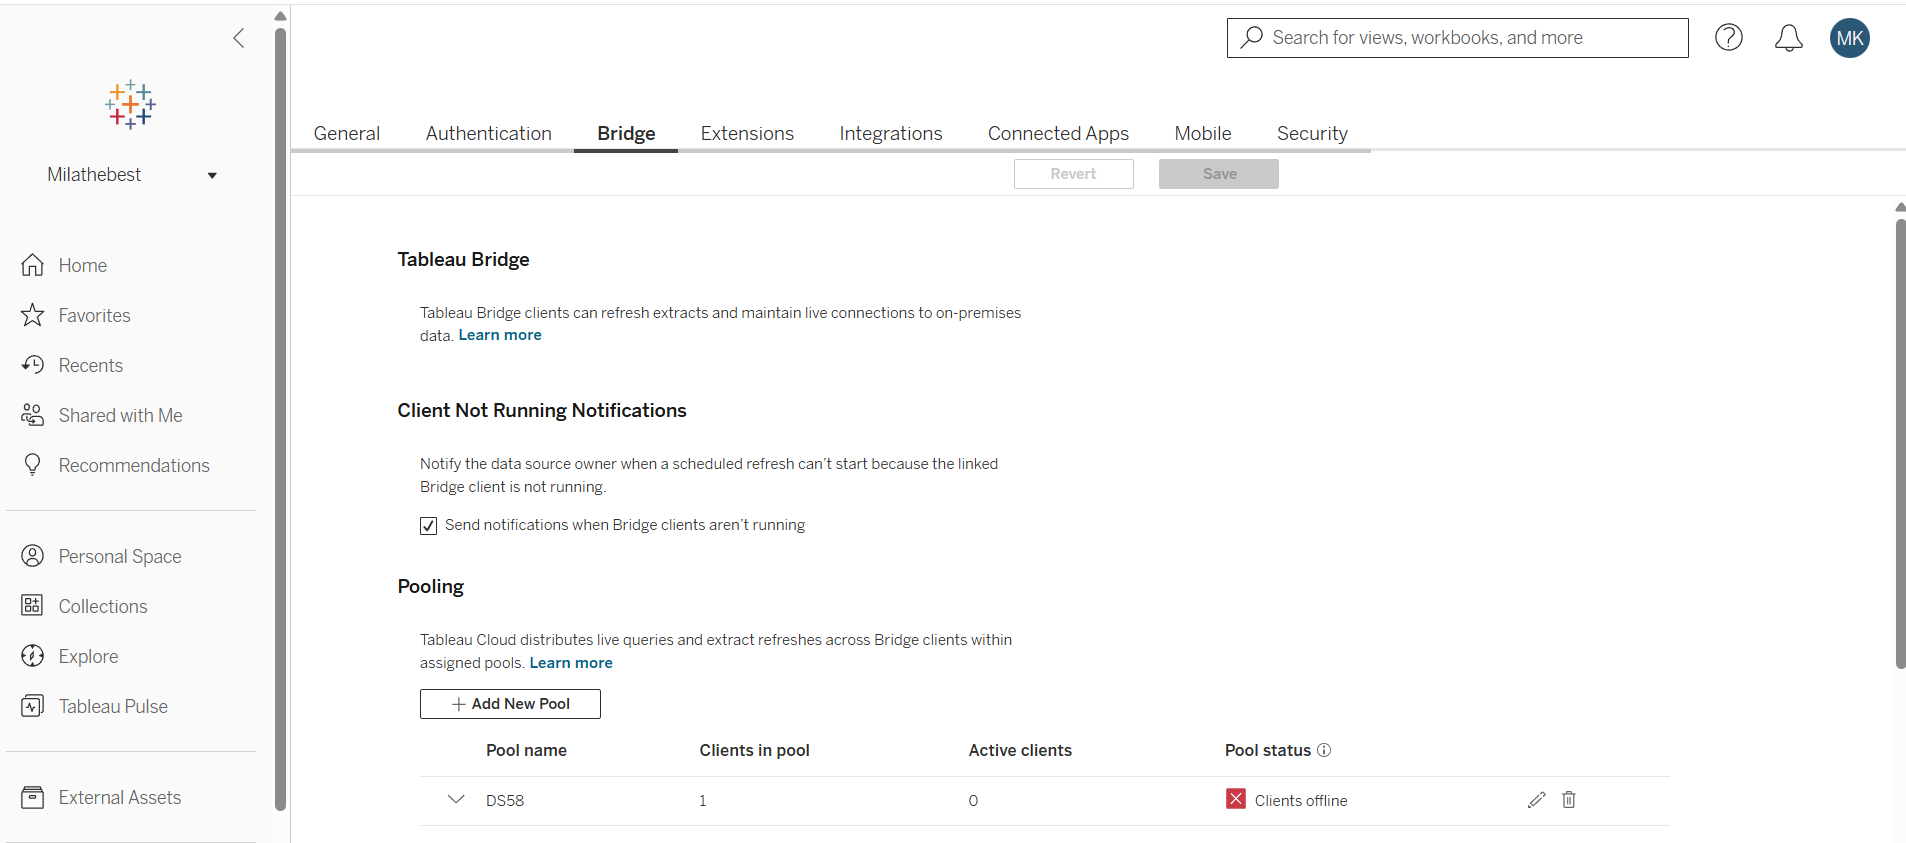
With the live connection wired up, I built the "My amazing car sels" dashboard: a target-vs-actual view by country. Each blue bar is the actual sales Amount, and the black tick behind it marks the Target pulled live from my targets_MK table. The label on each bar shows the gap between the two.
Because the connection is live, this is where it gets satisfying. I could jump back into DBeaver, run one of those UPDATE statements, and the target lines on the dashboard would shift to match — without republishing anything. After the updates, the USA came in below its target while Spain, France, and Australia landed above theirs, and the variance labels recalculated to prove it.
That loop — edit SQL → live connection → dashboard updates — was the real lesson of the session.
Tableau Cloud vs Tableau Server: a quick aside
A question that came up was why we used Tableau Cloud rather than Tableau Server. They do many of the same things — sites, publishing, permissions, scheduled refreshes — but the difference is who runs the infrastructure:
| Tableau Cloud | Tableau Server | |
|---|---|---|
| Hosting | Fully hosted by Tableau/Salesforce (SaaS) | You host it yourself, on-prem or in your own cloud |
| Maintenance | Handled for you — upgrades, uptime, hardware | Your team manages upgrades, patching, capacity |
| Reaching private data | Needs Tableau Bridge (as I used here) | Can sit inside the network directly |
| Cost model | Subscription per user, no hardware to buy | Licensing plus your own hardware and admin time |
| Best when | You want speed and no infrastructure to run | You need full control or strict data-residency rules |
The short version: Cloud trades some low-level control for far less overhead — and Bridge is the bridge (literally) that lets a hosted service still talk to private databases.
The virtual laptop: why we worked this way
A lot of this didn't happen on my physical computer at all — I worked on a virtual laptop, a virtual desktop hosted in the company's environment and accessed remotely. Once you've set up a live Bridge connection, the reasons for that become obvious:
1. Network access. Both DBeaver's connection to the RDS database and the Tableau Bridge client need to run somewhere that can actually reach that private data. A virtual laptop lives inside the right network, so it can, without exposing the database to the open internet.
2. Security. The sensitive data never leaves the corporate environment. If a physical laptop is lost or stolen, no confidential data goes with it — you were only ever viewing a stream.
3. A standardized environment. Everyone gets the same DBeaver, the same drivers, the same Tableau version, the same permissions — which kills the classic "but it works on my machine" problem.
4. Always-on and powerful. A virtual machine can stay running (handy for keeping a Bridge client alive) and lean on server-grade resources rather than a laptop's hardware.
5. Remote and flexible work. You can pick up exactly where you left off from any device, because the desktop lives in the cloud, not on one specific machine.
6. Compliance. For regulated data, keeping everything inside a controlled, auditable environment isn't a nice-to-have — it's a requirement.