


The goal of Dashboard Day 2: Recreate a Makeover Monday in PowerBI. Considering that many of our makeover Mondays are done with a high time crunch, having the full day to learn the software and recreate our visuals seemed like a solid challenge.
I started with a Makeover Monday I never posted: Top 100 games by Metacritic score. In Tableau, I filtered to Legend of Zelda games and made a fancy bar chart. It seemed like a really easy 'getting started' challenge.
Working in PowerBI was a really smooth experience for building the basic chart.
I ended up using a stacked bar to recreate the dual axis effect!
With my dashboard recreated, I wanted to expand on it. I decided to grab the Wikipedia table of units sold per game and a secondary review, in order to compare how they ranked with different scoring systems and how many units they sold.
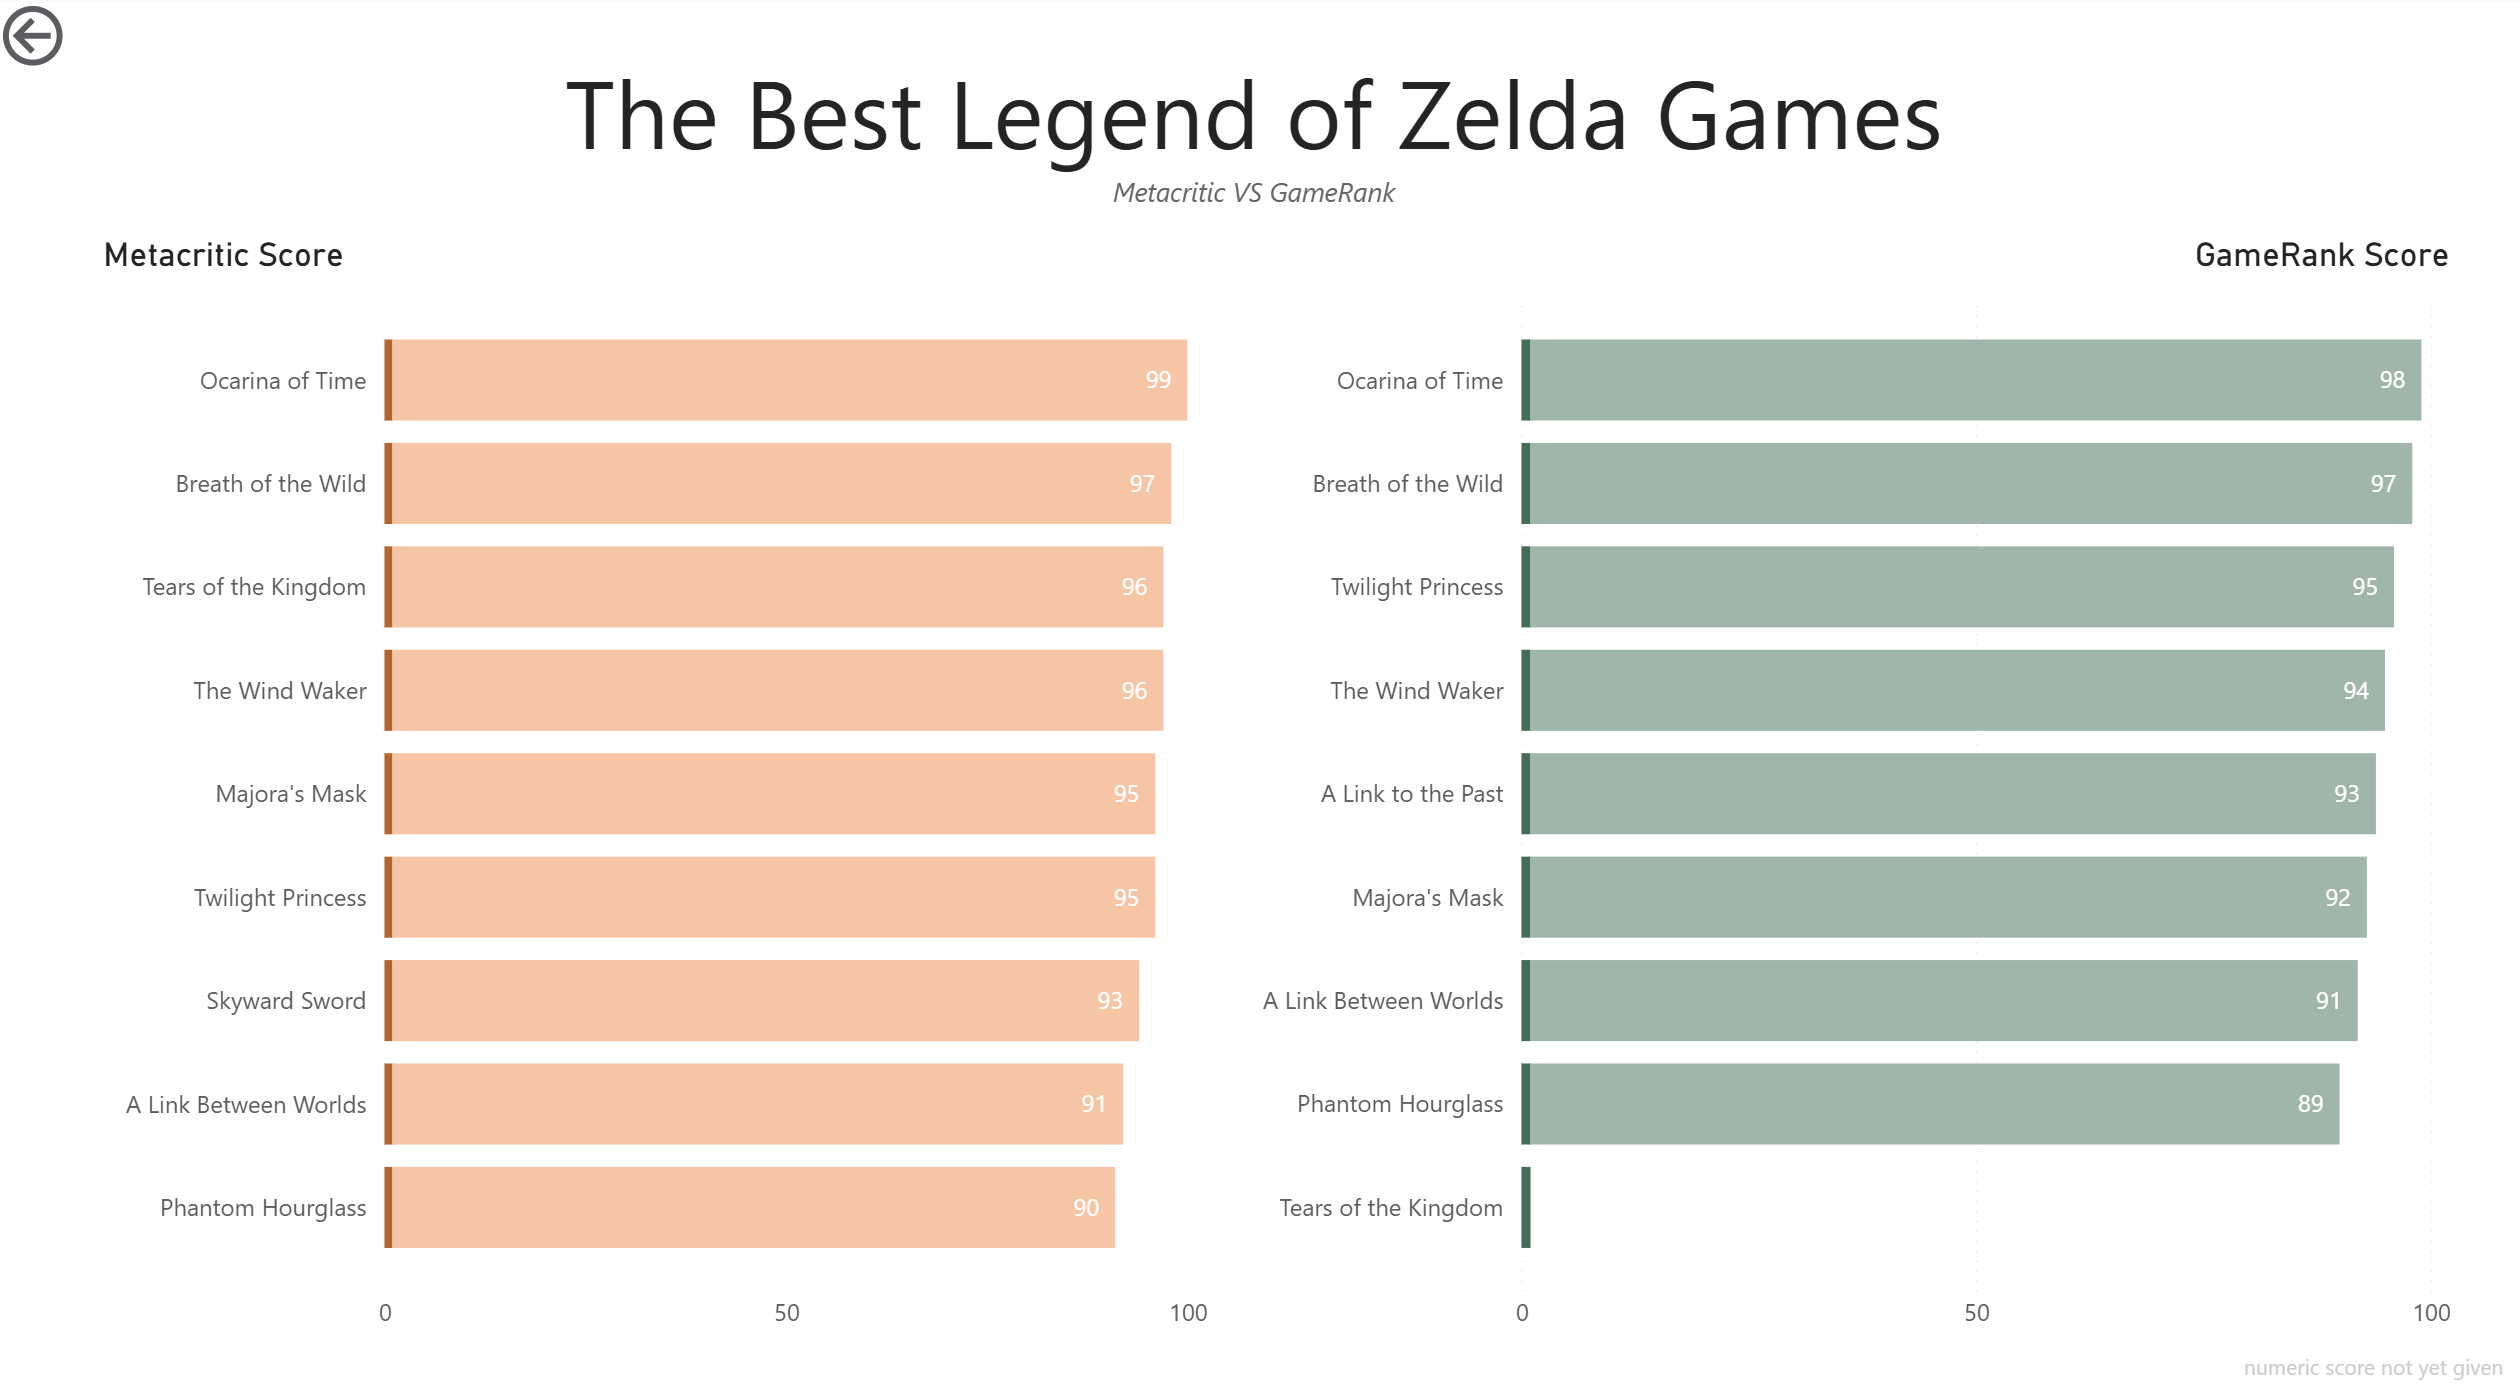
The goal was to make a Drill Down Dashbaord of Game information, and some sort of toggle / dropdown to change between my Metacritic score, GameRanking Score, and Units sold, the same way I would use a parameter in Tableau.
Joining was.... strange. I initially tried to build a relationship, but it did not behave as I expected. The join.... also did not behave as I expected.
I had to take a back and clean the titles of the tables until I could create a 1:1 relationship, which was a whole lot better!
With the 1:1 relationship, I could suddenly use the drill-down functionality with either chart and access all fields from each.
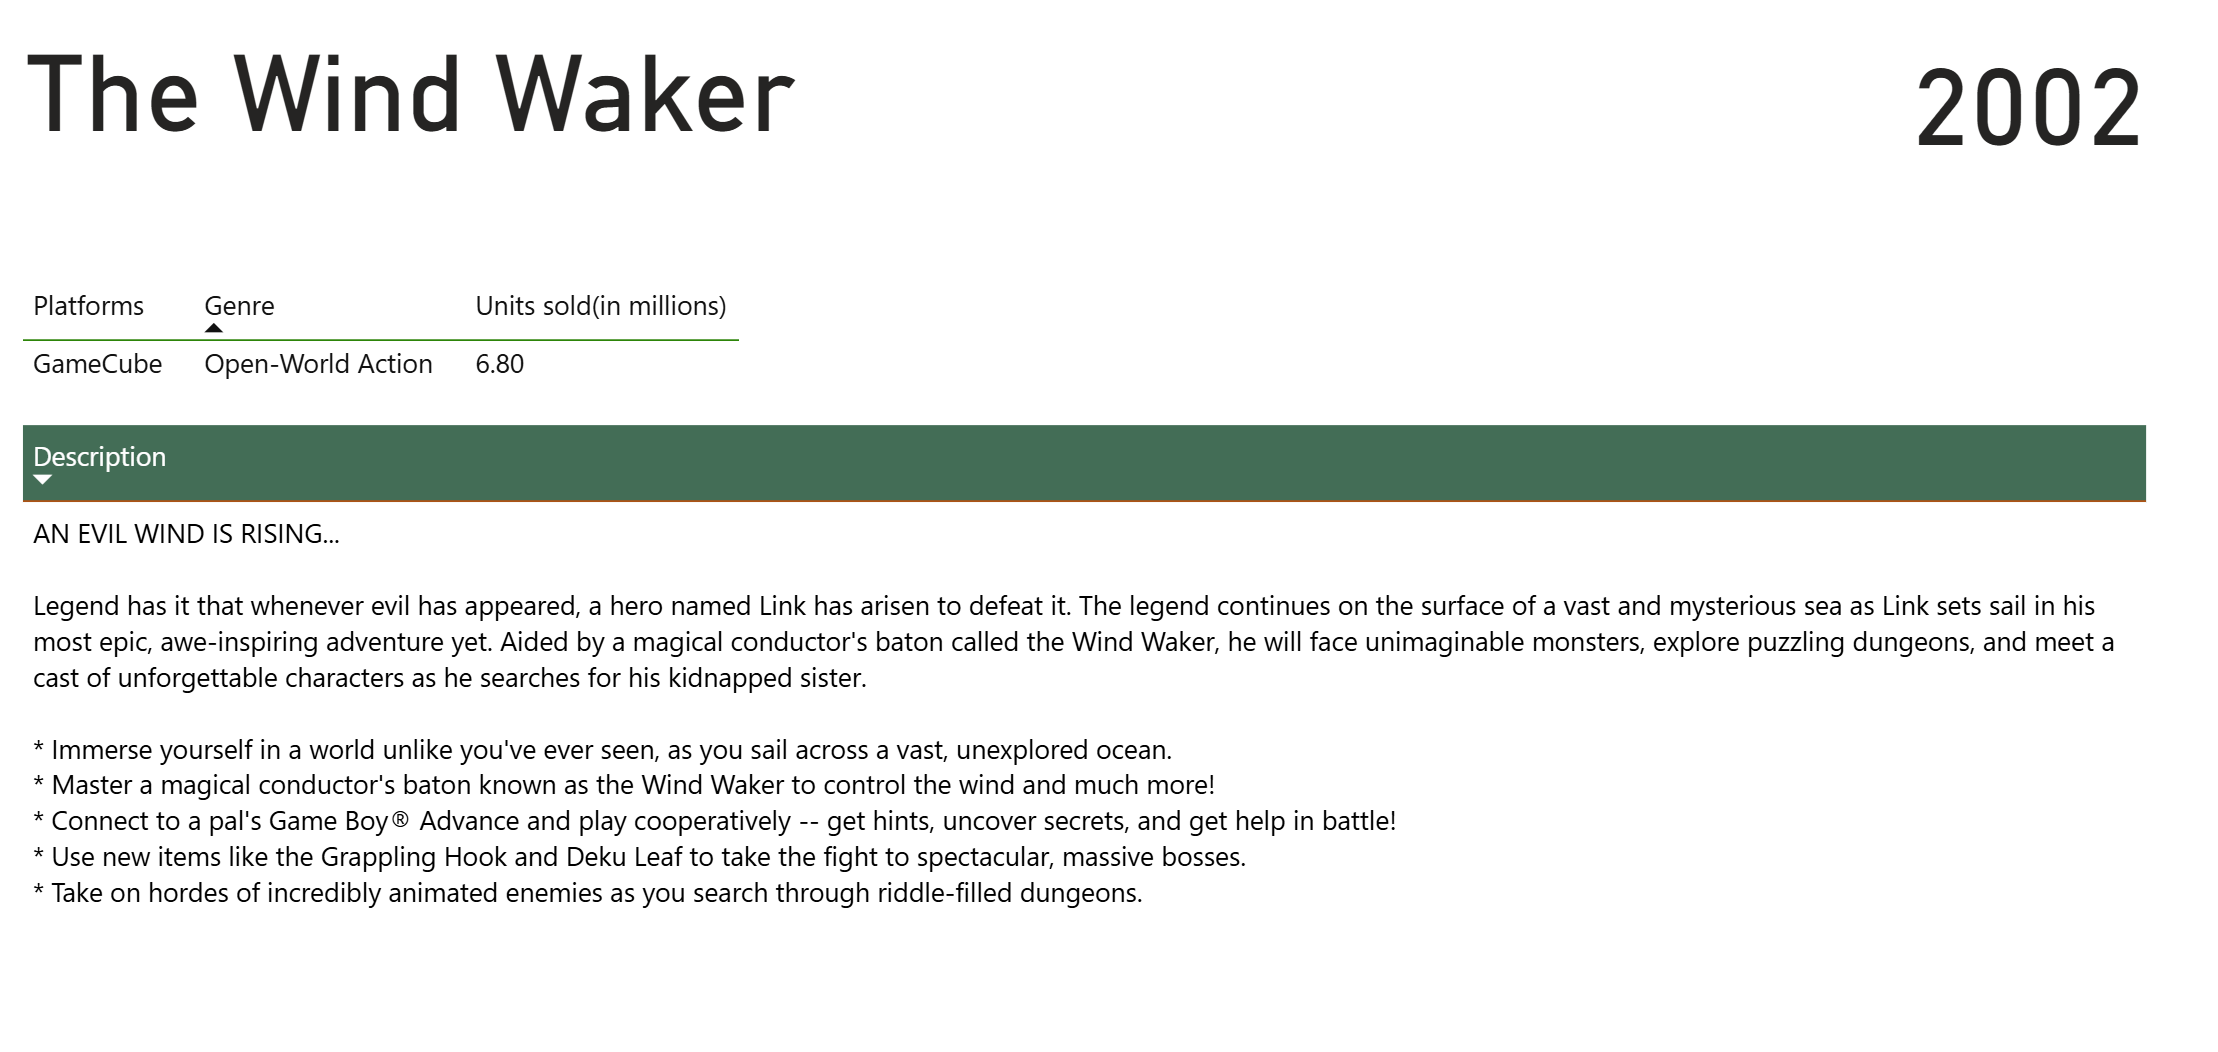
When building my drill down / game detail page, I desperately missed tableau and easy methods for adding cell text to dashboards. I ended up using a whole lot of tables.
As for the dropdown....
I was not able to implement it!
I ended up choosing to compare the two different scores as bars. Hovering over the bars provides the tooltip and allows a user to go to the detail page.