


During training at the Data School, we use a lot of different software to manipulate data in some way. The backbone of it all comes from a programming language called SQL (Structured Query Language). SQL comes in many different flavors, the first that we deal with being Snowflake's version.
Snowflake is a SaaS data company, which we use at the Information Lab for data storage and analysis. Snowflake stores our data and we can use SQL to interact with it. Luckily for me, our Snowflake server has a handful of Preppin' Data challenges to practice our SQL skills with. Here we will be continuing the series of blog posts, following our looks at Power Query, Alteryx, and Python with a more fundamental software.
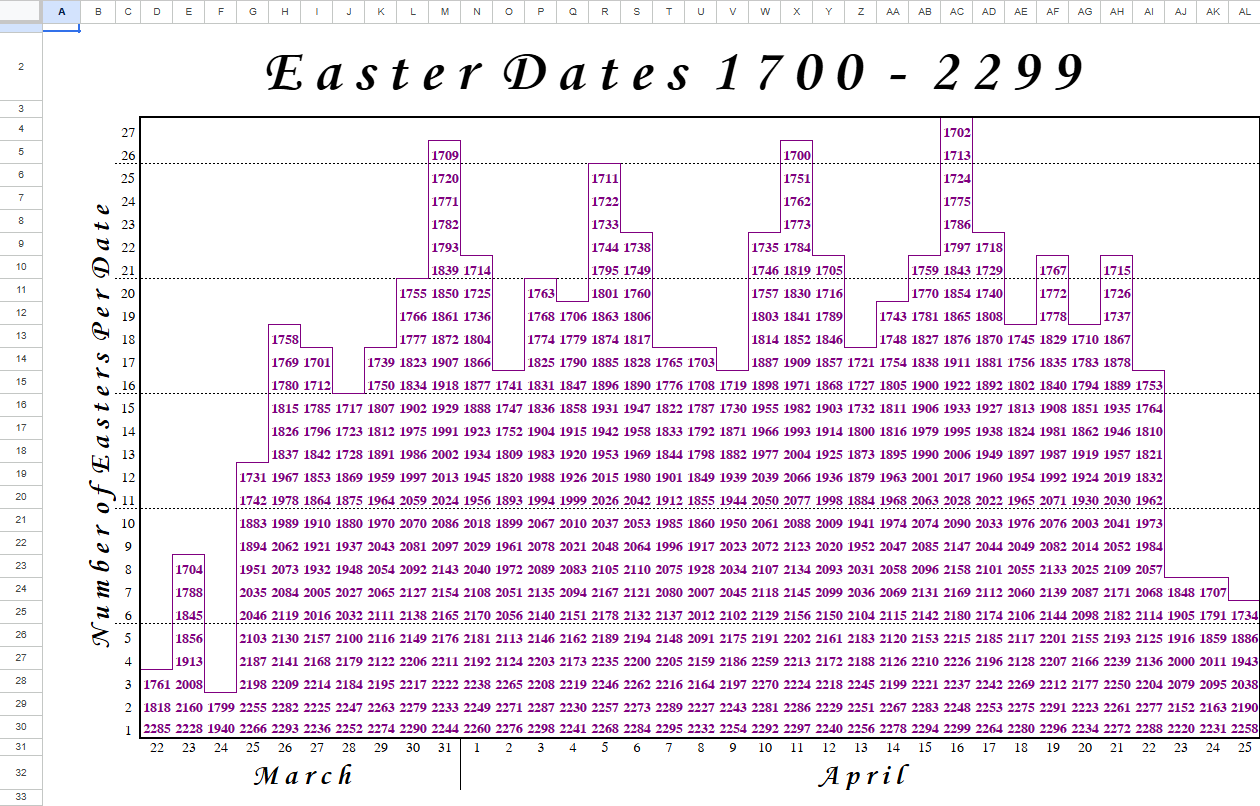
For this blog, we'll be looking at Preppin' Data 2023 Week 15 - Easter Dates, which has a rather simple output and only a single input file. However, this input file is a poorly structured Excel file which, while good for reading as a human, isn't convenient for computer use.
Due to the structure of the input, the main challenge comes from figuring out how to combine the different elements of the Excel together to get the dates that we want for the output. A common issue that Excel has when working with data preparation is that joined cells together don't appear in each row and column that it takes up. This requires some extra work to fill in the empty rows, which here is for the months.
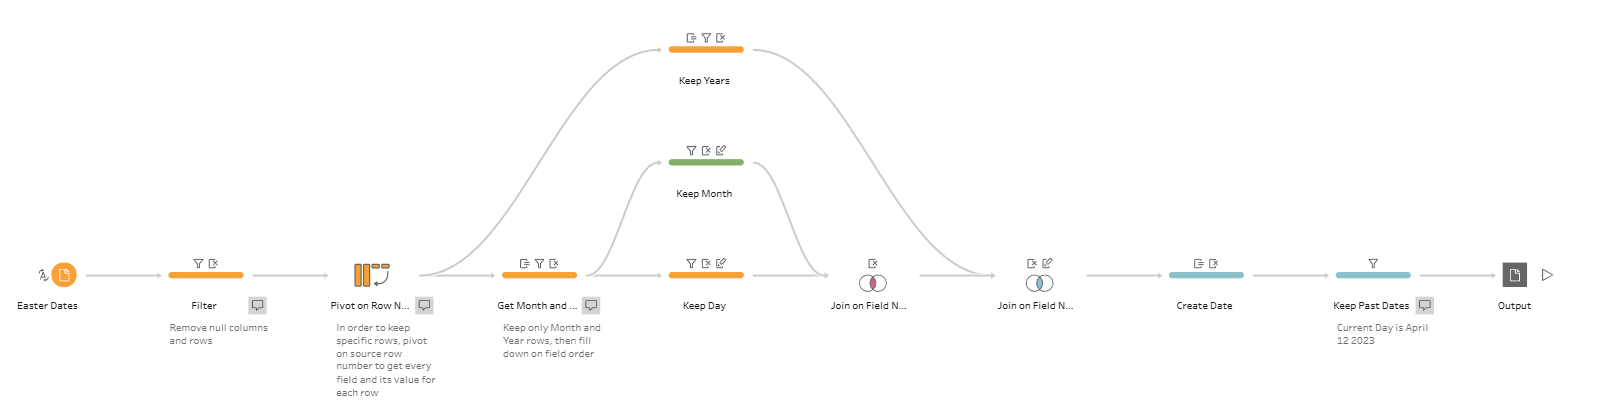
My steps for 2023 Week 15's solution:
- Input the data, getting the inherit row number of the data.
- Remove null fields and rows, including fields and rows with useless information.
- Pivot on row number.
- Create three tables based on the row number: month, day, and year.
- For the records with the day and month information, sort on the field number and fill down the empty values.
- For the years, filter out the null values.
- Join all three tables back based on the field number.
- Create the Easter dates with the completed year, month, and day fields.
- Filter the Easter dates based on if it is before April 12th 2023.
- Output the data.
Based on these steps, a Tableau Prep workflow and a SQL file were created. Plenty of bug fixing and testing occurred along the way, especially compared to the other blogs in this series I have done.
This was probably one of the most difficult data preparation challenges that I've done so far. The main difficult was figuring out the structure of the excel sheet and how to work the rows that I needed into columns. Through trial and error, with plenty of issues with pivoting and unpivoting, I was able to put together the workflow.
The main issue comes from how to connect the dates together. The year is located in most of the rows, but depends on the field. The days appear in every field, but only in a single row. And the month appears in a single row, but not in every field, requiring a fill across(?). There would need to be some way to look at these rows and perform manipulations to them, and then be able to join them back based on the field number. This is where the row number comes in handy.
When done in SQL, the complexity of the problems leads to a decently long file for the solution that we get.
WITH Pivoted AS (
    SELECT
        "Row ID",
        REPLACE("Field", 'X_', '')::INT AS "Field",
        REPLACE("Values", ' ', '') AS "Values"
    FROM (
        SELECT
            ROW_NUMBER() OVER (ORDER BY (SELECT 1)) AS "Row ID",
            IFNULL(X_3::VARCHAR, '-1') AS X_3,
            IFNULL(X_4::VARCHAR, '-1') AS X_4,
            IFNULL(X_5::VARCHAR, '-1') AS X_5,
            IFNULL(X_6::VARCHAR, '-1') AS X_6,
            IFNULL(X_7::VARCHAR, '-1') AS X_7,
            IFNULL(X_8::VARCHAR, '-1') AS X_8,
            IFNULL(X_9::VARCHAR, '-1') AS X_9,
            IFNULL(X_10::VARCHAR, '-1') AS X_10,
            IFNULL(X_11::VARCHAR, '-1') AS X_11,
            IFNULL(X_12::VARCHAR, '-1') AS X_12,
            IFNULL(X_13::VARCHAR, '-1') AS X_13,
            IFNULL(X_14::VARCHAR, '-1') AS X_14,
            IFNULL(X_15::VARCHAR, '-1') AS X_15,
            IFNULL(X_16::VARCHAR, '-1') AS X_16,
            IFNULL(X_17::VARCHAR, '-1') AS X_17,
            IFNULL(X_18::VARCHAR, '-1') AS X_18,
            IFNULL(X_19::VARCHAR, '-1') AS X_19,
            IFNULL(X_20::VARCHAR, '-1') AS X_20,
            IFNULL(X_21::VARCHAR, '-1') AS X_21,
            IFNULL(X_22::VARCHAR, '-1') AS X_22,
            IFNULL(X_23::VARCHAR, '-1') AS X_23,
            IFNULL(X_24::VARCHAR, '-1') AS X_24,
            IFNULL(X_25::VARCHAR, '-1') AS X_25,
            IFNULL(X_26::VARCHAR, '-1') AS X_26,
            IFNULL(X_27::VARCHAR, '-1') AS X_27,
            IFNULL(X_28::VARCHAR, '-1') AS X_28,
            IFNULL(X_29::VARCHAR, '-1') AS X_29,
            IFNULL(X_30::VARCHAR, '-1') AS X_30,
            IFNULL(X_31::VARCHAR, '-1') AS X_31,
            IFNULL(X_32::VARCHAR, '-1') AS X_32,
            IFNULL(X_33::VARCHAR, '-1') AS X_33,
            IFNULL(X_34::VARCHAR, '-1') AS X_34,
            IFNULL(X_35::VARCHAR, '-1') AS X_35,
            IFNULL(X_36::VARCHAR, '-1') AS X_36,
            IFNULL(X_37::VARCHAR, '-1') AS X_37
        FROM PD2023_WK15_EASTER_DATES
    )
       UNPIVOT("Values" FOR "Field" IN
                (X_3,X_4,X_5,X_6,X_7,X_8,X_9,
                 X_10,X_11,X_12,X_13,X_14,X_15,X_16,X_17,X_18,X_19,
                 X_20,X_21,X_22,X_23,X_24,X_25,X_26,X_27,X_28,X_29,
                 X_30,X_31,X_32,X_33,X_34,X_35,X_36,X_37)
        )
    WHERE "Row ID" > 1 AND "Values" != ''
)

SELECT
    TO_DATE(years."Year" || '-' || months."Month" || '-' || days."Day",
    'YYYY-MMMM-DD') AS "Easter Date"
FROM (
    SELECT
        "Field",
        "Values" AS "Year"
    FROM Pivoted
    WHERE "Values" != '-1' AND "Row ID" > 3
) AS years
INNER JOIN (
    SELECT
        "Field",
        "Values" AS "Day"
    FROM Pivoted
    WHERE "Row ID" = 3
) AS days
    ON years."Field" = days."Field"
INNER JOIN (
    SELECT
        "Field",
        FIRST_VALUE("Values") OVER (PARTITION BY "Group" ORDER BY "Field") AS "Month"
    FROM (
        SELECT
            "Field",
            "Values",
            COUNT(IFF("Values" = '-1', NULL, "Values")) OVER (ORDER BY "Field") AS "Group"
        FROM Pivoted
        WHERE "Row ID" = 2
    )
) AS months
    ON years."Field" = months."Field"
WHERE "Easter Date" < DATE_FROM_PARTS(2023,4,12)
ORDER BY "Easter Date" ASC
The code I wrote uses a CTE (Common Table Expression) to help divide up the work that needs to be done, especially as the same manipulation needs to be used throughout several sub-queries. The CTE, here aliased as 'Pivoted', helps to define the form of the table that we want to use. Most likely due to my inexperience, there is a long section dedicated to each and every field needed for the pivot, converting it to a string type and dealing with null values. In the end, we get the pivoted table based on the row number, created using a window calculation that I wrote about in a previous blog post.
This table is then used to create the three tables defined in the plan, with the year and day fields being easily defined based on the row that I want to look at. The more difficult one is the month, where the joined cells leave an empty value where the sheet shows a value. A fill down is needed here, since the values for the months need to be carried down row by row. At the first level, a number is assigned to group together the existing month and the following rows, using the fact that the COUNT function ignores null values. This is then used as a partition, with the field numbers being used as the order of the table, to fill in the empty values as the first value of each partition will be a non-null value.
In the end, the same output is achieved. Tableau Prep is easier to put together as it uses a drag-and-drop interface to get each of its manipulations done. It speeds up the process for putting together the pivots and anything dealing with multiple fields at once. Since it follows through steps, it makes it much easier to envision how to get to the solution.
With SQL, there is a much greater level of flexibility with how I can achieve my goal. I find it easier to understand CTEs and Sub-queries rather than re-using the same step multiple times, with more use cases for CTEs across different contexts. Since Tableau Prep uses the same logic as SQL to complete each of its steps, there is almost nothing that Tableau Prep can do that SQL cannot. Finally, it also is more accessible for other users as SQL exists as a language rather than as a software, so more people can use what I have done without a financial barrier.