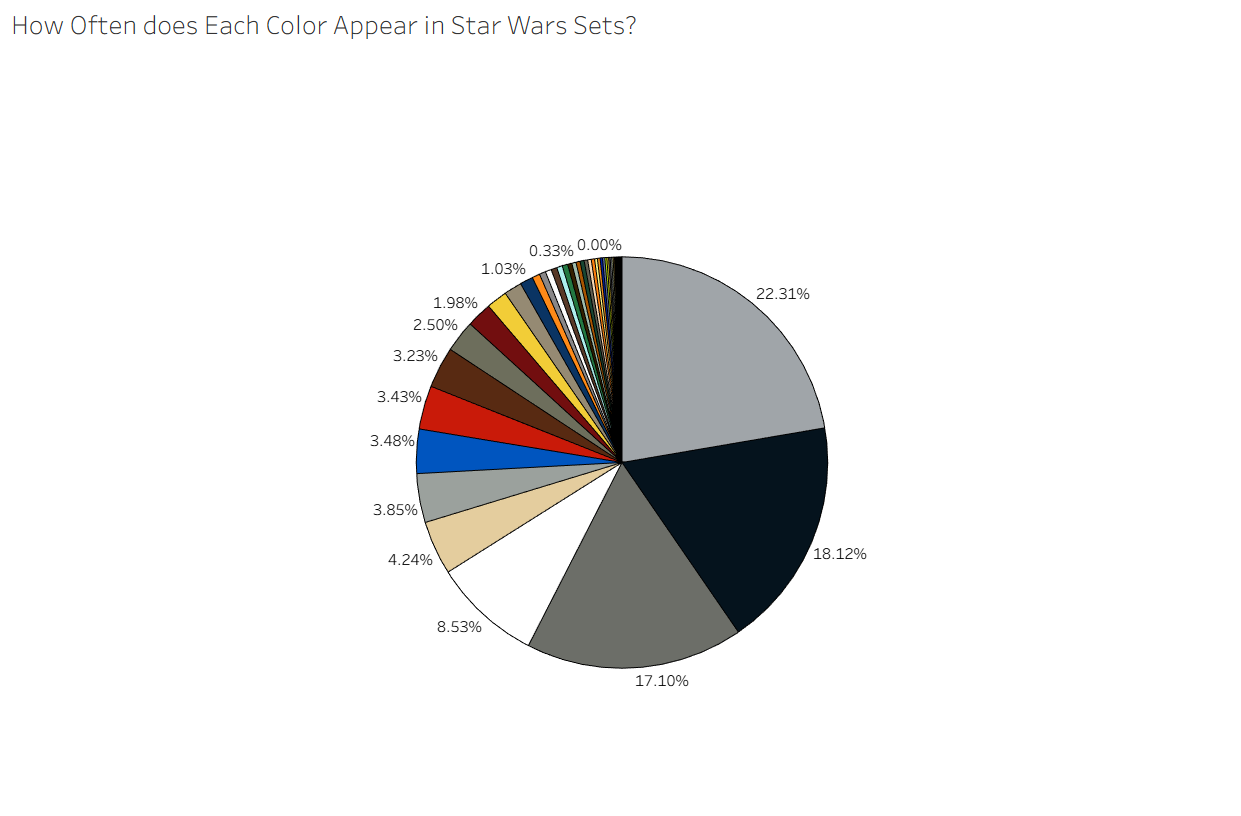
As part of Day 7 of the Summer of SQL, you ended up working with LEGO data and in the end, need to make a dashboard based on a view that you create using the LEGO data in a database. While working and designing the dashboard for that day, I ended up running into a small problem. I had a dimension field in my data containing a color RGB value and wanted to color my marks based on that dimension.
The issue was this: Tableau didn't have a way to assign colors based on those values. There were too many options for me to set the palette automatically so I started to look into some solutions. My first idea was to try to create a palette in my Tableau preferences file to add a color palette that contained every hex color.
The hope was that if I had that color palette, it would recognize the field and assign it to the right color. But with hex codes for color, there are 256 different options for each of the 3 colors, leading to 16,777,216 different colors! In order to get all of those colors, formatted in the correct XML, into my currently existing preferences file, I decided to write a short python script to add those in.
def number_to_hex(i):
    return format(i, "#04X").replace("0X", "")

file_location = "{{Tableau Preference .tps File Location}}"
before = []
after = []
at_end = False
with open(file_location, "r") as preferences:
    for line in preferences.readlines():
        if at_end:
            after.append(line)
        elif "/preferences" in line:
            at_end = True
            after.append(line)
        else:
            before.append(line)

middle = []
middle.append("  <color-palette custom='true' name='All Colors' type='regular'>\n")

for i in range(256):
    for j in range(256):
        for k in range(256):
            middle.append("\t<color>#" + number_to_hex(i) + number_to_hex(j) + number_to_hex(k) + "</color>\n")

middle.append("  </color-palette>\n")
all_lines = before + middle + after

with open(file_location, "w") as results:
    results.writelines(all_lines)
This script reads in the Tableau Preferences file and parses it line by line. It checks when the preferences section comes to an end, which is where we want to put in the full RGB color palette into. This made my preferences file to be a staggering 400MB, which saves into my workbook if I use that color palette.
Unfortunately, this didn't assign the colors the way I wanted it to. It loaded in slow and when I was able to assign the palette, it assigned it in order of the available colors in the color palette. This wasn't what I wanted, so I needed to go back to the drawing board.
I decided to look into the Tableau workbook file itself to see if I could see some kind of solution there. Even though you interact with your Tableau workbook through Tableau desktop when working locally, the file itself is another XML file with details about the different sheets, data sources, and all other elements of a dashboard.
After looking through the file, it turns out that there's an element within the XML file that defines the color mapping for a field. If we use the automatic color palette, it simply maps each value in the field to a color and doesn't assign it based on an existing palette. This means that we can edit the colors that each of the values are set to. But since the number of values is unfeasibly large for me to manually edit, we can edit it within the workbook XML directly.
REMINDER TO BE CAREFUL AND USE BACKUPS WHEN EDITING YOUR DASHBOARD DIRECTLY
In order to assign the colors of each value in my RGB field to the value of the field itself, I wrote another python script to read in the dashboard's XML and edit the values in the color encoding for my specific field. Using some regex and loops allowed me to find the specific section of the dashboard that I wanted.
It finds the correct encoding element and looks through each value-to-color mapping. It looks at the value of the field itself and sets the color to be the same as the value. It then adds all the edited element back into the dashboard XML and saves it.
import re
#Takes the hexcodes from a field and assigns it to be its color
#Must have the non-custom automatic palette already assigned
file_location = "{{Tableau .twb File Location}}"
field_name = "{{Name of Hexcode Field}}"
dashboard = []
encoding_section = False
current_color = ""
current_value = ""
with open(file_location, "r") as preferences:
for line in preferences.readlines():
#If in the correct color encoding section
if encoding_section:
if line.strip().startswith("<map"):
#Store the format of the color mapping element
current_value = line
elif line.strip() == '</map>':
#Assign the correct color and add back to the dashboard
dashboard.append(current_value.split("'")[0] + "'#" + current_color.split(""")[1] + "'" + current_value.split("'")[2])
dashboard.append(current_color)
dashboard.append(line)
else:
#Store the hexcode name
current_color = line
else:
#Otherwise add the line back into the dashboard
dashboard.append(line)
#Check if in the encoding section based on the element and the attribute describing the hexcode field
if re.search("<encoding.*field='.*Color RGB.*]'.*>", line.strip()) is not None:
encoding_section = True
#If out of the encoding, stop checking for the color
elif encoding_section and line.strip() == "</encoding>":
encoding_section = False
dashboard.append(line)
#Overwrite dashboard with new color encoding
with open(file_location, "w") as new_dashboard:
new_dashboard.writelines(dashboard)
Once run, it's now updated my dashboard with the correct colors assigned for my sheet. Since the encoding is based on the field rather than a specific sheet, it will update the color wherever that field is used on the color mark. And now, I can have my dashboard now has accurate colors for its field, allowing for a better experience!