


I recently started learning Sigma and was surprised by how intuitive and easy this BI tool is to learn compared to others. For those unfamiliar, Sigma, like Power BI, is a cloud-native analytics and business intelligence platform that provides a spreadsheet-like interface on top of cloud data warehouses.
I decided the best way to learn was to recreate one of my Tableau dashboards, as a hands-on approach would be most beneficial. As I continued exploring, however, I noticed subtle differences and workflows that weren't as intuitive as I'd thought. One of those was how parameters work in Sigma. Although conceptually the same, setting them up, just like setting them up in Tableau, took some prior knowledge and research.
In this blog, I will provide a tutorial on how to set up parameters and understand the workflow in Sigma, using the Tableau Sales Superstore dataset. I will set up a simple parameter that changes a bar chart's dimension from segment to category.
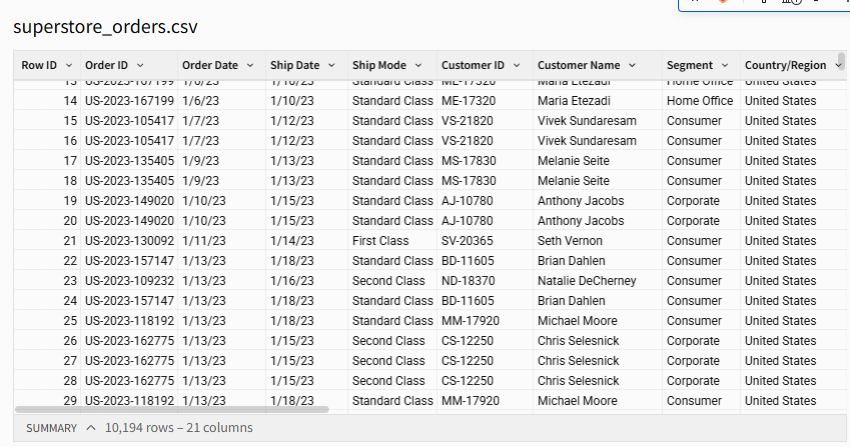
First, you must load your data with this icon.

Choose the data you want, and it will load it in as a table
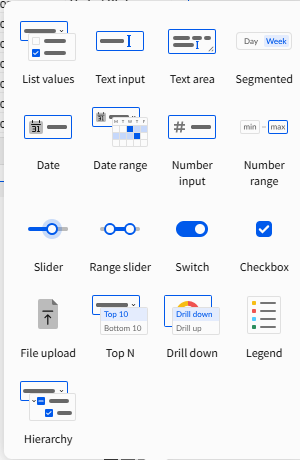
From there, to create the “buttons” for the parameter, click Control and then Segmented in the top right. I chose Segmented since we only have two values to toggle between; it provides a clean 2-button toggle switch rather than a dropdown menu.

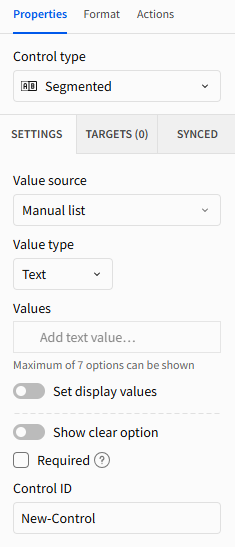
From there, it will create a button, and when clicked, it will show this properties pane. This exactly emulates how you set up a parameter in Tableau.
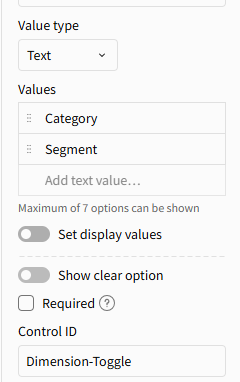
We want to keep the value type as text, and type in our two dimensions: “Category” and “Segment”.
At the bottom of the pane, we can see Control-ID. This is important: in Tableau, it's the parameter name, and in Sigma, it is what we'll reference in calculations. Each control element has a unique control ID. For this example, I'll name it Dimension-Toggle.
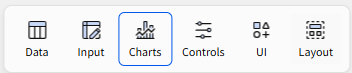
Now that we've created our parameter, we can start building our bar chart. Click Charts, then Bar Chart.
For the Y-axis, I will drag order-id and aggregate to count. To create an X-axis that changes depending on what you choose, we need to configure a calculated field, exactly as we do in Tableau.
The formula I will use is:
IF([Dimension-Toggle] = "Category", [Category], [Segment])
Essentially, this is saying: If the Parameter Dimension Toggle is set to Category, then show Category; otherwise, show Segment.
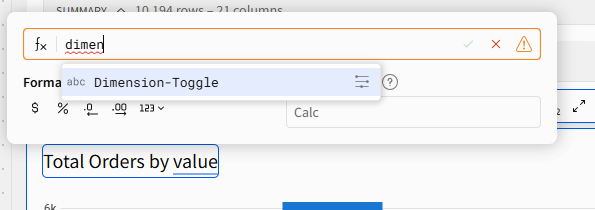
Once you create this, drag it to the X axis, and your bar chart should respond accordingly to what is selected. To incorporate the parameter in the title and have the title be dynamic, click into the title, type =, then start typing your control's name. Sigma will show it in a dropdown for you to select
The final bar chart should look like this:
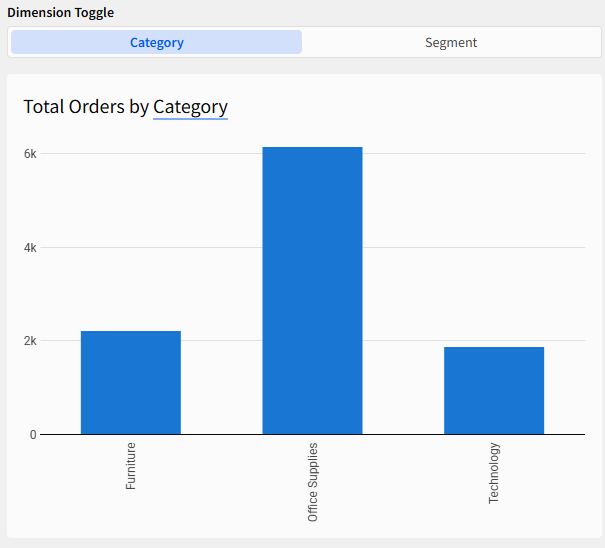
And that's it, you’ve just built a parameter in Sigma! What surprised me most going through this process is how similar it is to the underlying logic in Tableau. A Control is just a parameter with a different name, and the Control ID is doing the same job your parameter name always did. The setup is different; however, once you know where to look, the concepts transfer easily.