


Ever built a calculation that changes when someone clicks a slicer? Sometimes, the challenge isn't the calculation itself, but understanding what your denominator includes.
In Power BI, two useful DAX functions for this are ALL and ALLSELECTED. They can look similar, but they help answer different questions.
Let's imagine we are working on sales data.
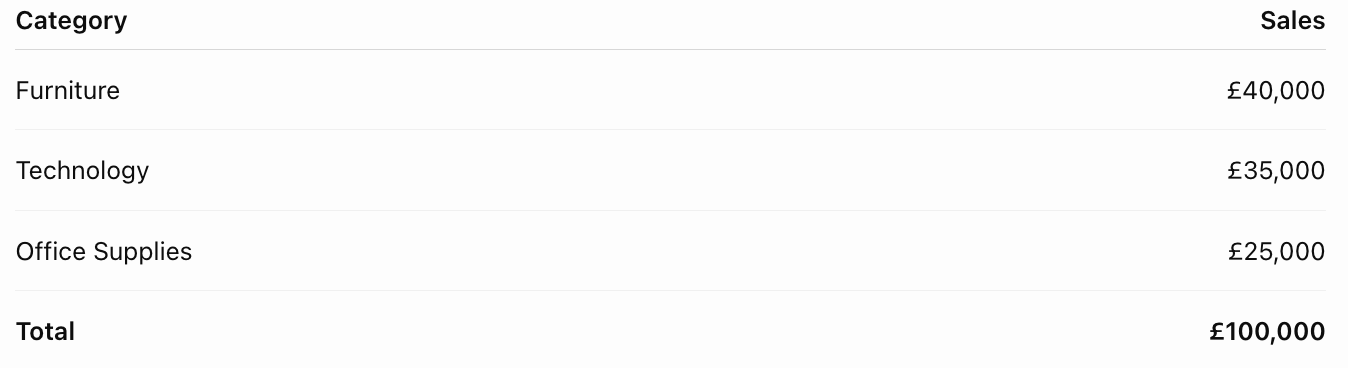
Furniture accounts for 40% of total sales. But what happens if a user selects only Furniture and Technology?
Should Furniture still represent 40% of all sales, or 53.3% of the selected sales?
ALL: The bigger picture
The ALL function removes filters from specified tables or columns within a calculation.
First, let's create a basic measure:
Total Sales =
SUM(Sales[Sales Amount])
This will store the SUM of sales.
Now, let's use our ALL function.
Sales ALL Categories =
CALCULATE(
    [Total Sales],
    ALL(Sales[Category])
)
The CALCULATE function evaluates the measure under a modified filter context. Here, ALL(Sales[Category]) removes the filter on the Category column for the denominator.
So, what happens when we select only Furniture and Technology?
The denominator remains £100,000 because the category filter is removed from that calculation.
Furniture still represents 40% of sales, and Technology represents 35%.
In other words, we're asking: "How much does this category contribute to sales across all categories?"
This is useful when you want a consistent reference point, even when users narrow down their selections.
One important detail: removing the 'Category' filter doesn't automatically remove every other filter. For example, a 'Year' filter can still affect the result. The exact behaviour depends on which table or columns you pass to ALL and how your data model is configured.
ALLSELECTED: Focusing on the selection
Sales Selected Categories =
CALCULATE(
    [Total Sales],
    ALLSELECTED(Sales[Category])
)
Instead of removing the relevant external selections, ALLSELECTED can remove the current visual's category grouping while retaining the selected categories.
With Furniture and Technology selected, the denominator becomes £75,000.
Furniture now represents:
£40,000 ÷ £75,000 = 53.3%
Technology represents:
£35,000 ÷ £75,000 = 46.7%
The percentages add up to 100% because we're comparing the categories against the selected sales total.
Here, we're asking: "How much does this category contribute to the categories currently selected?"
This is particularly useful when building interactive reports where users want to explore the relative contribution of a subset of categories.
It's worth noting that ALLSELECTED is sensitive to the query and filter context in which it is evaluated. It doesn't simply preserve every filter a user has ever applied, so more complex reports may require closer inspection of the data model and DAX behaviour.
Seeing the difference side by side:
Let's imagine we selected ‘Furniture’ and ‘Technology’ in our slicer. This will be the output:
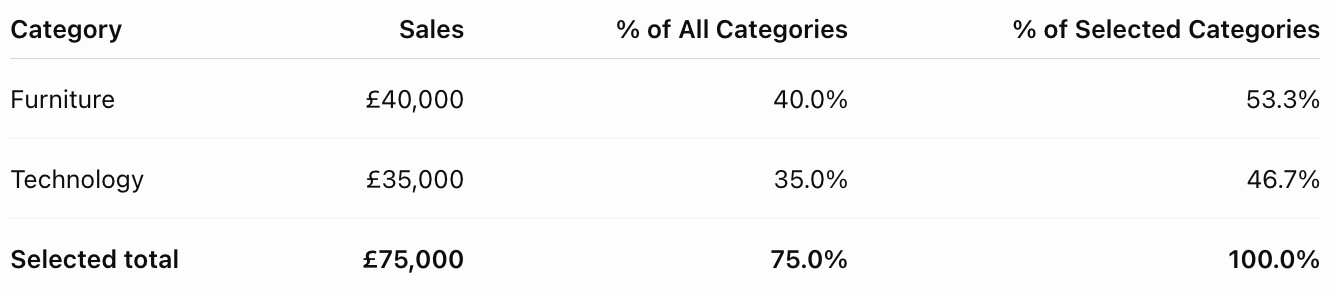
Notice that the sales values haven't changed. What changes is the denominator used to calculate the percentages.
This is the key difference between the two approaches in our example.
ALL gives us a reference point across all categories, whereas ALLSELECTED gives us a reference point across the selected categories.
Neither is inherently better. The right choice depends on the question your report is designed to answer.