


Alteryx is a powerful platform designed to streamline data preparation, blending, and analysis. For new users, the extensive tool palette can be daunting. However, the majority of complex analytical workflows are constructed from a core set of foundational tools.
This guide provides a functional overview of 12 essential tools that form the building blocks of most Alteryx workflows. Understanding their purpose and application is the first step toward mastering the platform
Part 1: Data Preparation and Cleansing
Ensuring data quality and structure is a critical preliminary step in any analytical process. These tools are fundamental for data hygiene.
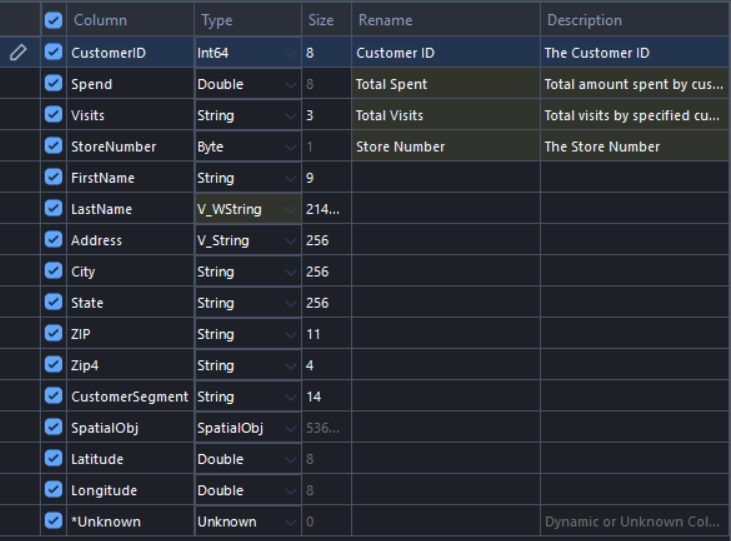
Select Tool

- What it does: The Select tool is used to manage the metadata of your dataset. It allows you to include or exclude columns, reorder them, rename fields, and modify data types and sizes.
- When to use it: Use this tool immediately after importing data to remove irrelevant columns, ensure field names are correct, and assign the proper data types (e.g., changing a text-based
[Sales]field to aDoubleorFixedDecimalfor calculations).
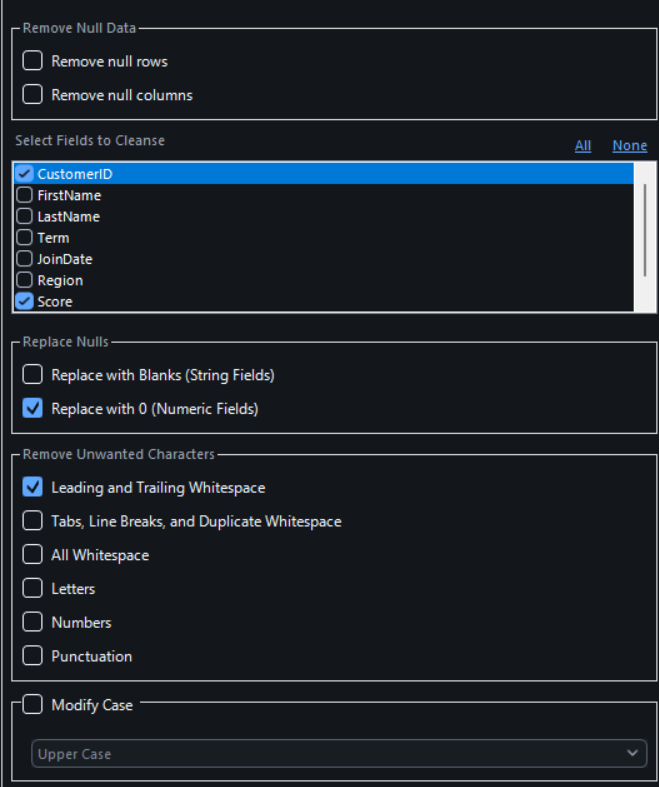
Data Cleansing Tool

- What it does: This tool is designed to address common data quality issues. It can efficiently remove leading/trailing whitespace, modify text case, and replace null values with blanks or a specified value.
- When to use it: Apply this tool when your dataset contains formatting inconsistencies, such as extra spaces in text fields or null values in numeric fields that need to be converted to zero before analysis.
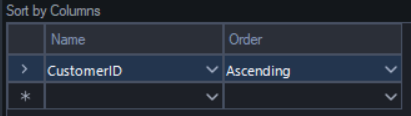
Sort Tool

- What it does: The Sort tool arranges the rows of your dataset into a specified order (either ascending or descending) based on the values in one or more columns.
- When to use it: This tool is a prerequisite for many operations, such as identifying top/bottom performers or preparing data for a Rank tool. For example, sort by
[Sales]in descending order to see the highest sales records first.
Part 2: Data Transformation and Filtering
These tools allow you to manipulate your data, create new fields, and isolate specific subsets for analysis.
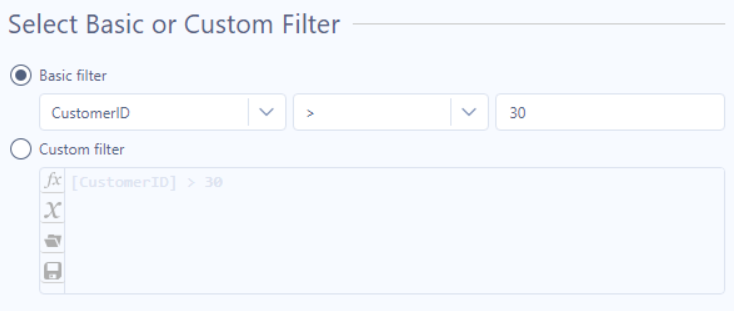
Filter Tool

- What it does: The Filter tool segments your data into two distinct outputs: True (T) and False (F). This split is based on a custom condition or expression you define.
- When to use it: Use this tool to isolate records that meet specific criteria. For instance,
[Region] = "North"would route all "North" records to the 'T' anchor, while all other regions would go to the 'F' anchor.
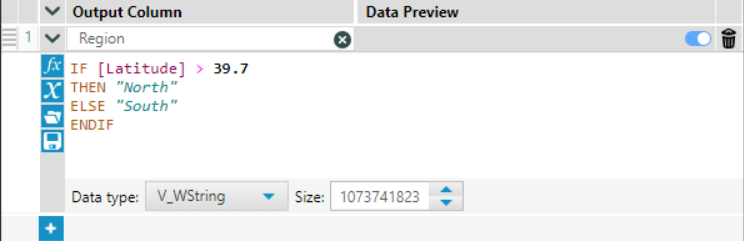
Formula Tool

- What it does: The Formula tool is a powerful component for data manipulation. It allows you to create new columns or update existing ones by applying a wide range of functions and expressions, from simple arithmetic to complex conditional logic.
- When to use it: This tool is used for feature engineering. A common use is creating a new
[Revenue]column by applying the formula[Price] * [Quantity].
Sample Tool

- What it does: The Sample tool extracts a specified subset of your data. It can be configured to select the First 'N' rows, a Random 'N'% of rows, or 1 of every 'N' rows.
- When to use it: This tool is invaluable during workflow development. When working with large datasets, you can insert a Sample tool near the input to select the "First 1000 rows," enabling rapid testing and iteration.
Rank Tool

- What it does: The Rank tool assigns an ordinal rank (e.g., 1, 2, 3) to records based on their value in a specified field. It can also perform this ranking within groups.
- When to use it: Use this tool to identify relative standing. For example, to find the top 5 products within each store, you would group by
[Store]and rank by[Sales]in descending order.
Part 3: Combining Data
These tools are essential for integrating data from multiple sources.
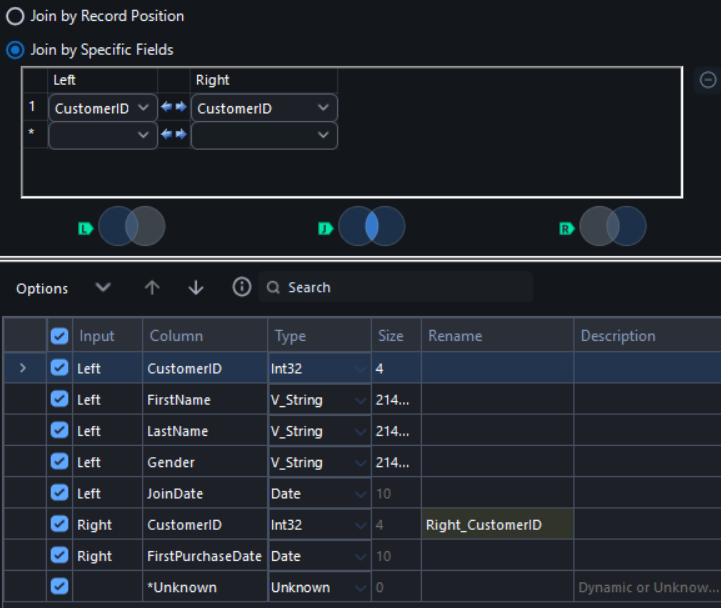
Join Tool

- What it does: The Join tool combines two data streams horizontally based on one or more common fields, known as join keys. It functions similarly to a SQL JOIN or an Excel VLOOKUP.
- When to use it: Use this when you need to enrich one dataset with information from another. For example, join a
Salesfile to aCustomerfile using[CustomerID]as the key to append customer details (like name and address) to each sales transaction.
Union Tool

- What it does: The Union tool combines two or more data streams vertically, appending rows to one another. It stacks datasets that share a similar structure.
- When to use it: This tool is used to consolidate data from multiple files. For example, if you have separate
January_Sales.csvandFebruary_Sales.csvfiles with identical columns, the Union tool will stack them into a single, combined dataset.
Part 4: Aggregating and Reshaping Data
This final set of tools is used to aggregate, pivot, and restructure data into a format suitable for reporting or visualisation.
Summarise Tool

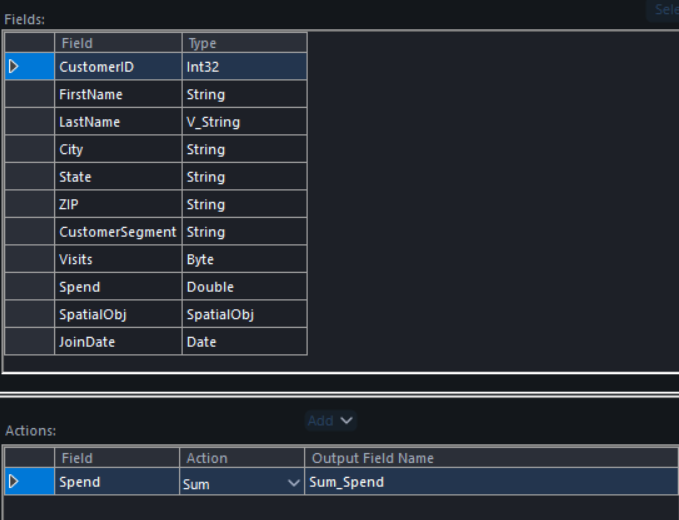
- What it does: The Summarise tool is the primary tool for data aggregation. It allows you to Group by one or more fields and perform actions on other fields, such as Sum, Count, Average, Min, and Max.
- When to use it: Use this tool whenever you need to move from row-level detail to an aggregated view. For instance, to find the total spend by CustomerID, you would Group by
[CustomerID]and Sum the[Spend]column.
Transpose Tool

- What it does: The Transpose tool reshapes data from a wide format to a long format. It pivots horizontal data (columns) into vertical data (rows).
- When to use it: Use this when your dataset has data points in column headers (e.g., separate columns for
Jan_Sales,Feb_Sales,Mar_Sales). Transposing this data creates a more analysis-friendly table with a[Month]column and a single[Sales]column.
Cross Tab Tool

- What it does: The Cross Tab tool is the inverse of Transpose. It reshapes data from a long format to a wide format, pivoting rows into new columns.
- When to use it: This tool is often used for creating final reports or matrices. Taking the "long" data from the Transpose example, you could use Cross Tab to create new columns for each month, with sales values in the cells.
🏁 Part 5: Data Output
This is the final step, to output the data you have transformed.
Output Data Tool

- What it does: The Output Data tool writes the results of your workflow to a specified file or database. It supports a vast range of formats, including Excel (
.xlsx),.csv, Tableau (.hyper), and various SQL databases. - When to use it: This is the final tool in your workflow, used to save your processed, analysed data for use in other applications or for archival purposes.
Conclusion
While Alteryx offers hundreds of specialised tools, mastering this core set of 12 will provide a solid foundation for the vast majority of data challenges. Proficiency is best built through practice; I encourage you to apply these tools to your own datasets to understand their utility and interaction.