


Building Star Schemas in Power BI
We have had a week of Power BI learning and that has been enough for a lifetime – I kid, we all love Power BI!
When you start Power BI, just like other programs, you need to bring data in to analyse and transform, which is where this blog helps!
Once you bring in the data, all the tables will be separated in the Power BI ‘Model View’. This is the key tab in order to understand the relationships between the different tables in your data. Here where we need to start to build the star schema.
PAUSE – HAVE YOU PLANNED??!!
At this stage we want to understand the common ‘fields’ (columns) in each table in order to create a relationship between them, so it is often (always) a good idea to write these down on a piece of paper, so you do not need to keep flicking through the data. Once you have fields which correspond in each dataset, or you have made these in Power Query, you are ready to build the star schema.
In Power BI, building a star schema means structuring your data so that one central fact table (for example, a sales table with each transaction from January to December) connects to several surrounding dimension tables (such as Date, Product, Customer, or Region). The fact table stores the measurable values you want to analyse (like revenue, quantity, or profit), while the dimension tables store descriptive context used for slicing and filtering.
In the example, I have made a star schema to assess book sales, author sales, author awards and the publisher. This information was in different sheets in an Excel file, so it is crucial to bring them all together in this schema for analysis.
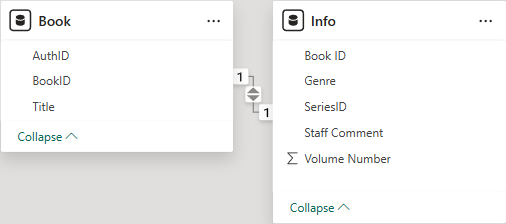
To begin, I built a fact table on the main sources of information, which was the ‘Book’ table and the ‘Info’ table. This relationship is through the joint field of Book ID. When the relationship line is a solid black line (it is in the picture above) then it means that the relationship is active, if it is dotted, the relationship is inactive – if you wanted multiple relationships then you would need to use the ‘USERELATIONSHIP’ DAX function to activate, explained in a blog to come.
I then used this fact table to create relationships with the other tables to answer questions with information on different Excel sheets.
The full data model I made is as follows:
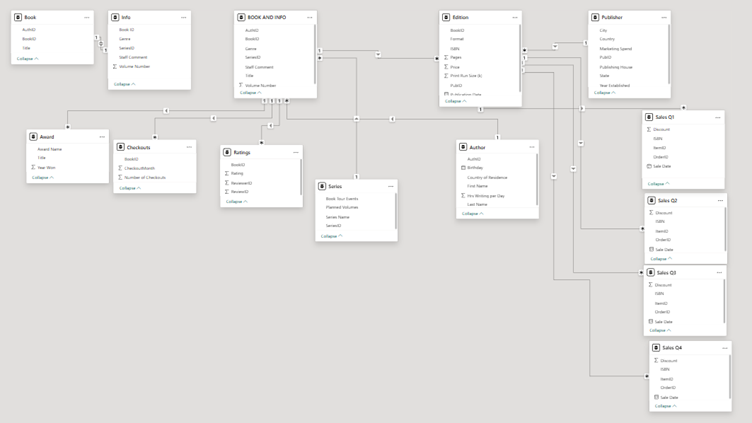
This image shows my full data model once everything has been brought together into a star-style schema. At first glance it can look a bit overwhelming, but it is actually doing something very simple: organising lots of separate Excel sheets into one clean structure that Power BI can understand and analyse properly. The tables in the middle contain the core information we care about (books and sales), and the tables around the outside add extra detail, such as authors, publishers, editions, awards, ratings, and checkouts.
The lines between the tables show how Power BI knows which tables are connected. Each line represents a relationship between two tables, usually based on a shared column like Book ID, Author ID, or ISBN. These relationships allow Power BI to pass information between tables, so that when you filter by an author or a publisher, the sales numbers update automatically. The small “1” and “*” symbols on the lines show how the data flows – one author can be linked to many books, one book can have many sales, but each sale only belongs to one book.
Keeping these relationships clear and one-directional is what prevents incorrect totals.
By setting the model up this way, I can answer questions that would be very difficult if the data stayed in separate sheets. For example, I can look at sales by author, compare publishers, or see whether award-winning books perform better, all without copying columns between tables.
This is why building a star-style schema is so important in Power BI. It keeps the model tidy, makes reports easier to build, and ensures the numbers you see are correct.