


When I first started learning Tableau, one of the few things I wanted to implement into my dashboards early on was chart swapping. Unfortunately at the time, this was out of my skillset. Luckily for you, this shall no longer be the case!
The first thing we're going to do is to create 2 charts of your choice, so we can swap between them!
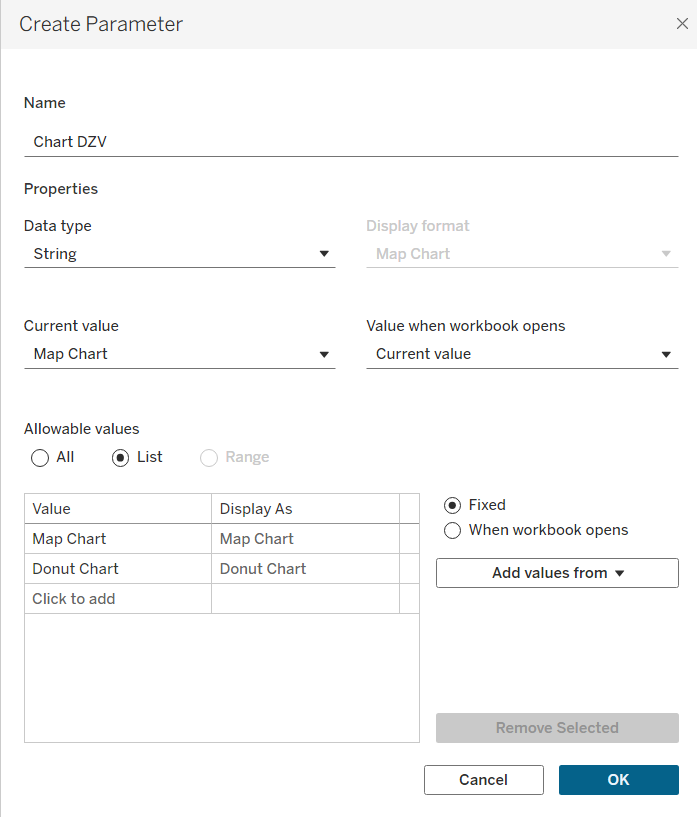
After we have our 2 charts, we are going to create a parameter. Make sure to use a proper naming convention for clarity. We want our data type to be string, and make sure to use List as the allowable values. This lets us write exactly what we want for our DZV parameter to control.
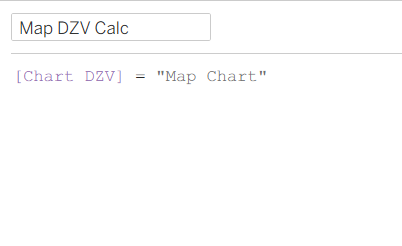
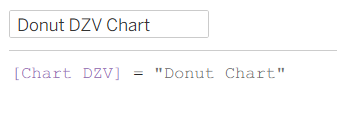
The next thing we're going to do, is to create 2 calculated fields. These calculated fields essentially connect the chart to the parameter. It states that when our parameter selects the option we want, then the calculated field is True. This lets Tableau know which chart is "True" and to display it.
Now let's apply this to our charts! As shown below, our Map chart and Donut chart are contained in the same horizontal container. (Highlighted within the blue container box)
IMPORTANT: To switch between different charts, they must be in the same container! You can also switch between different containers, such as having 2 vertical containers where you only want to display one at a time.
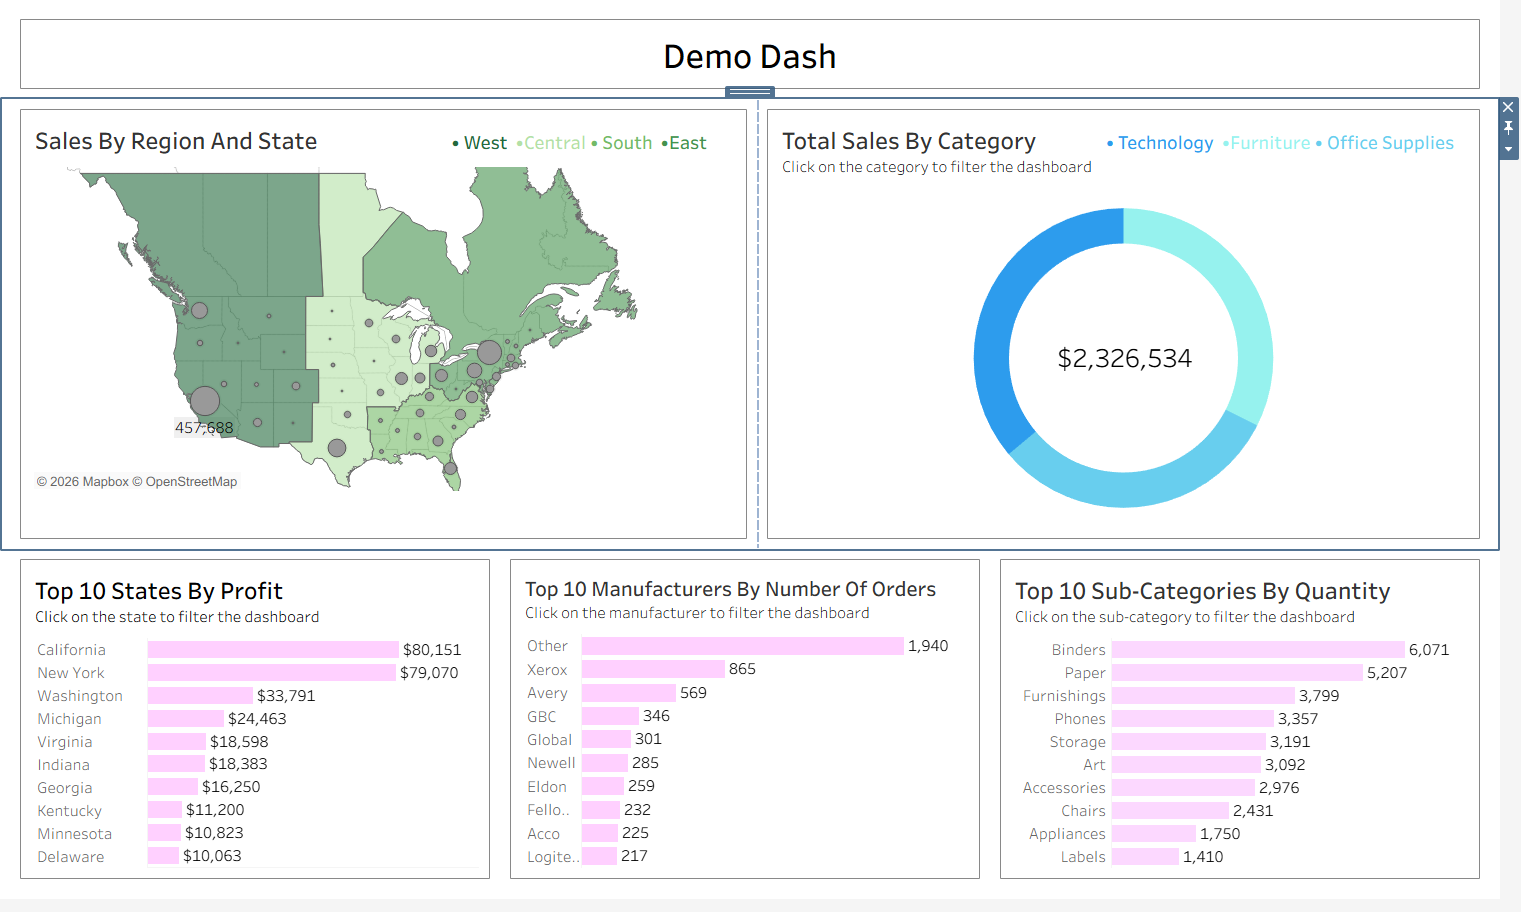
We are now going to select the Map chart by clicking on it, and then going into the layout pane. Here we click the check box "Control visibility using value", and select the calculated field we made for our map.
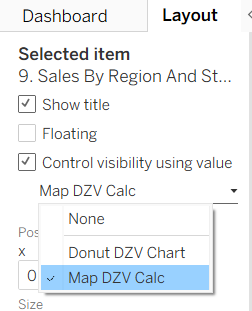
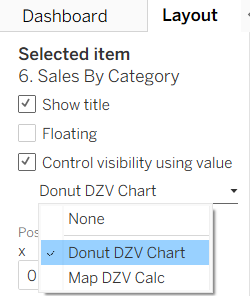
We do the same thing with our Donut chart, just selecting the calculation for that chart.
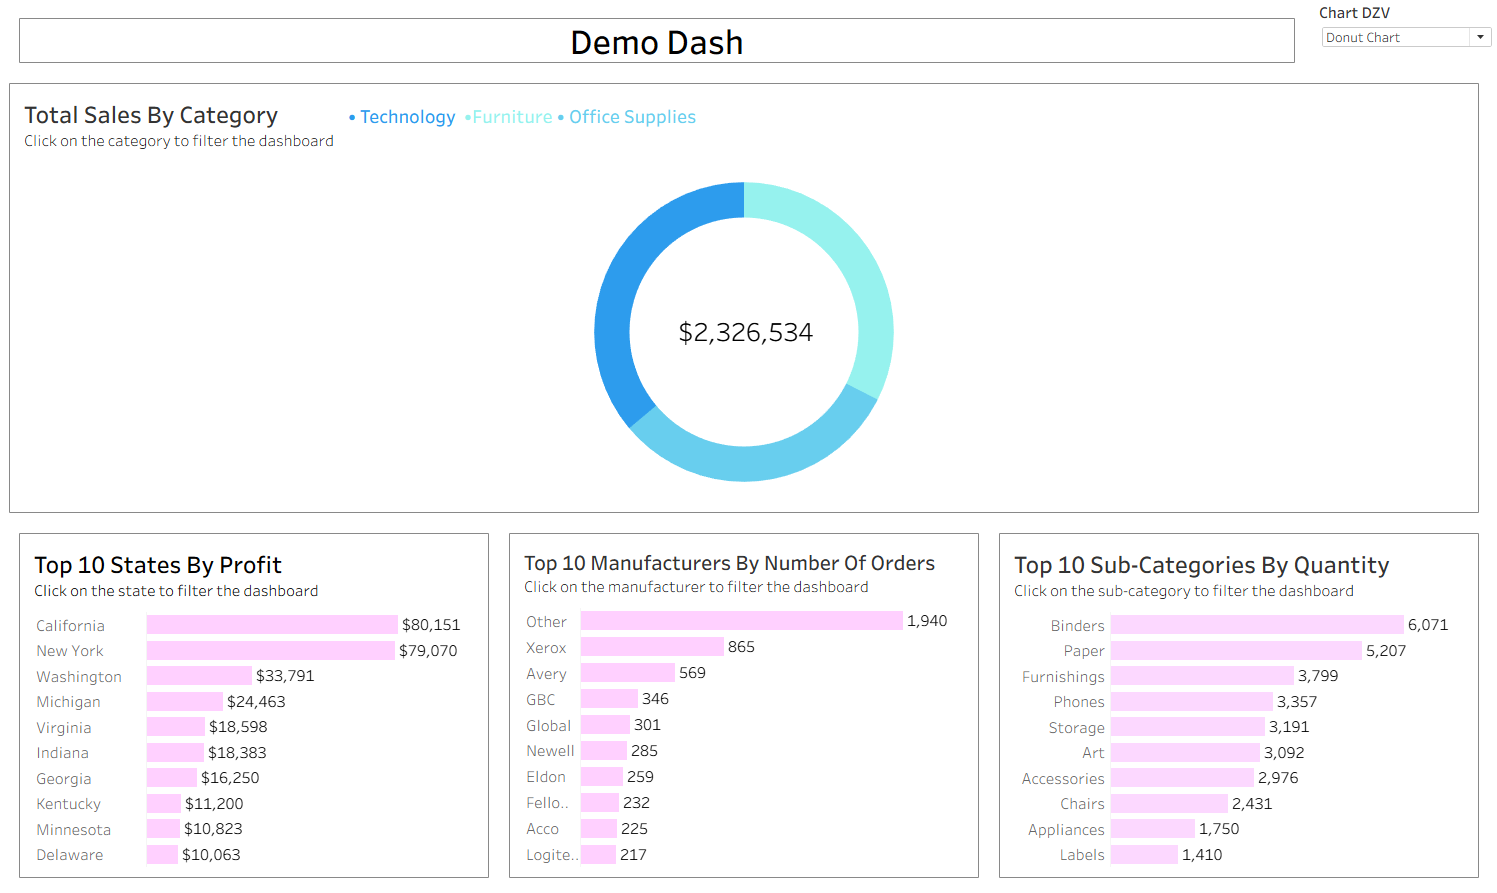
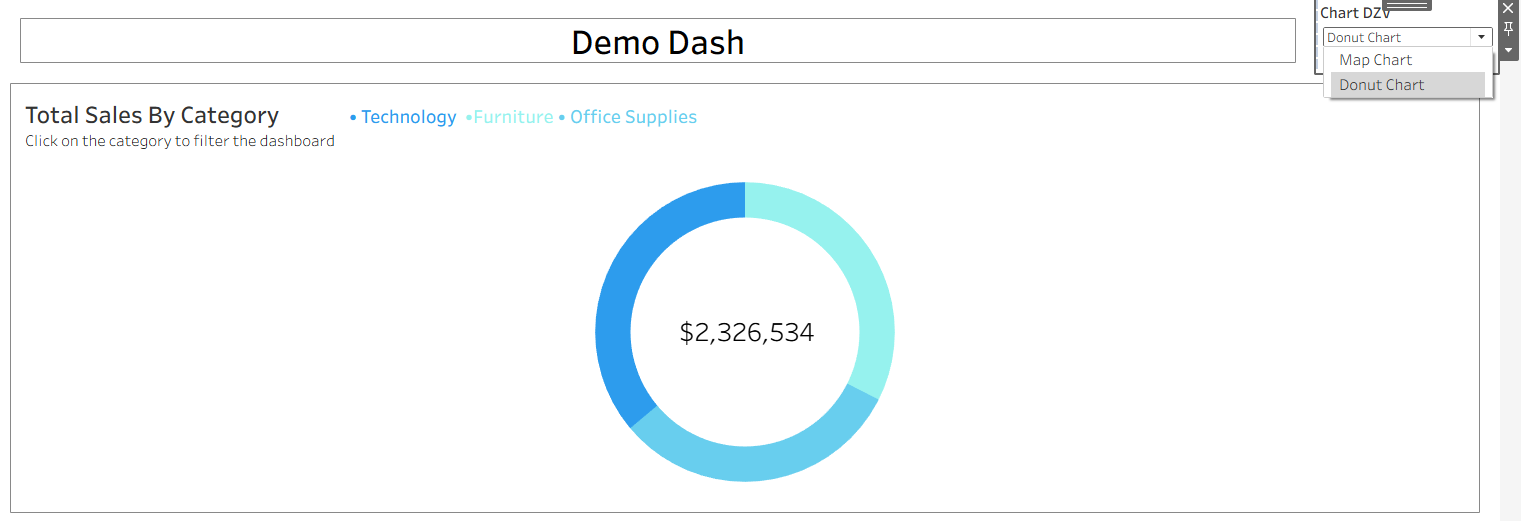
As you can see, we now have our Donut chart as the chart displayed!
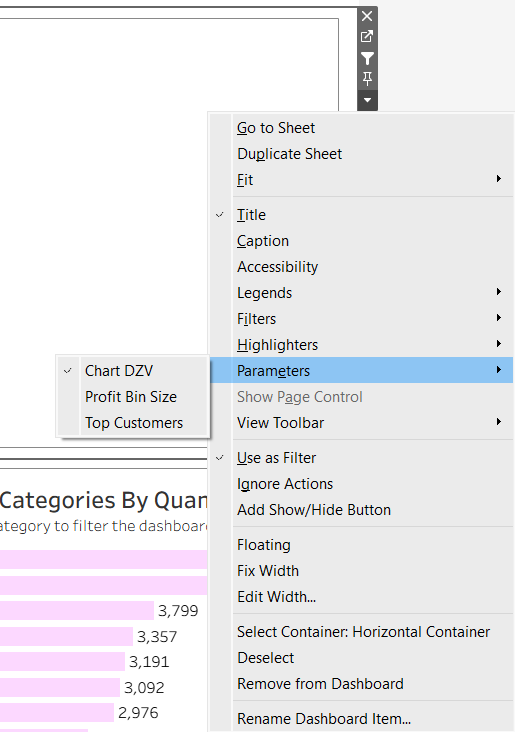
To bring up the parameter we made, open up the container menu and select parameters, and choose our Chart DZV parameter.
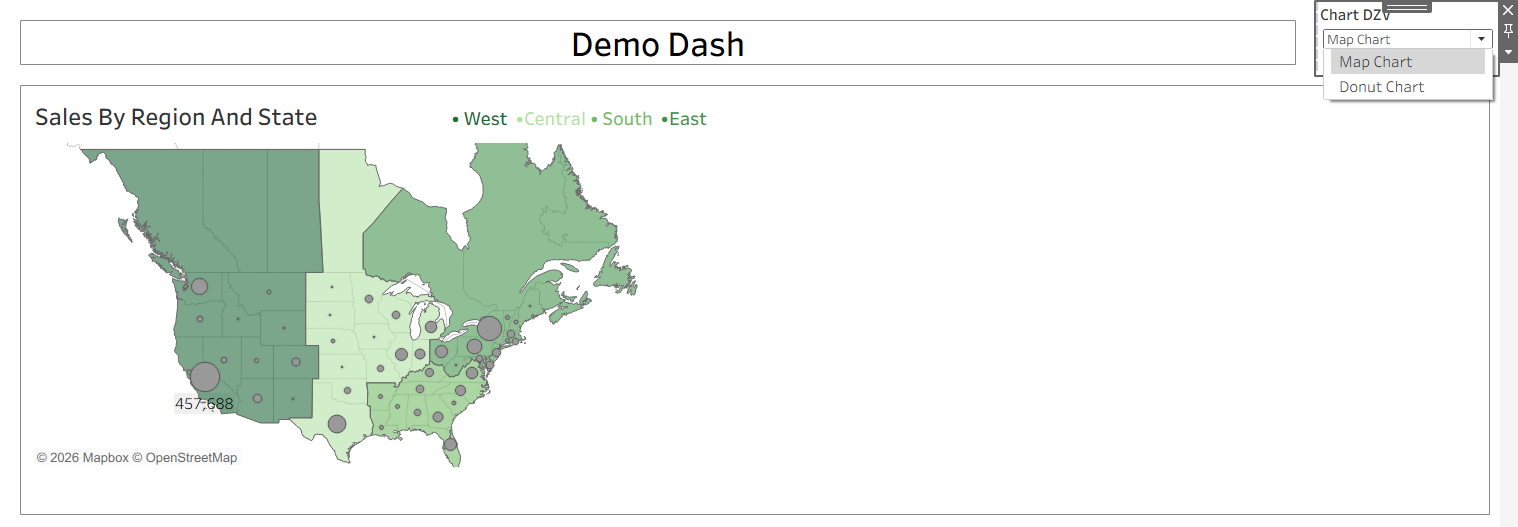
Now we are able to switch between our donut chart and our map! (Please make sure to format your charts accordingly, unlike me in this example!)
Hope that helps!