


Today we were tasked with loading 4000+ London Stock Exchange tables into Power Query, cleaning it and then building a dashboard on Power Bi.
The Brief:
- To have the ability to look at stock exchange at a high level - so looking at volatility, market momentum etc.
- To then further investigate this by each Ticker.
Cleaning Process:
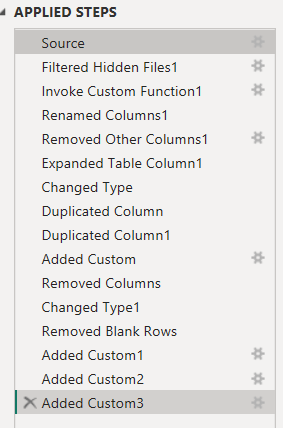
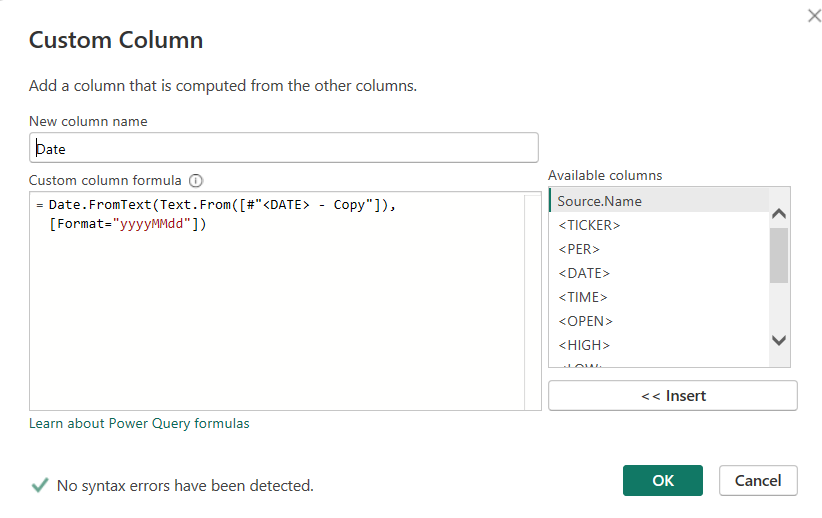
- There was not much to clean. All the data types were intact except for the date column. So, I used an M code:
Planning Stage:
I did not and still do not know much about financial data, so a lot of my time was spent researching and understanding common metrics used and what the best ways to display them would be.
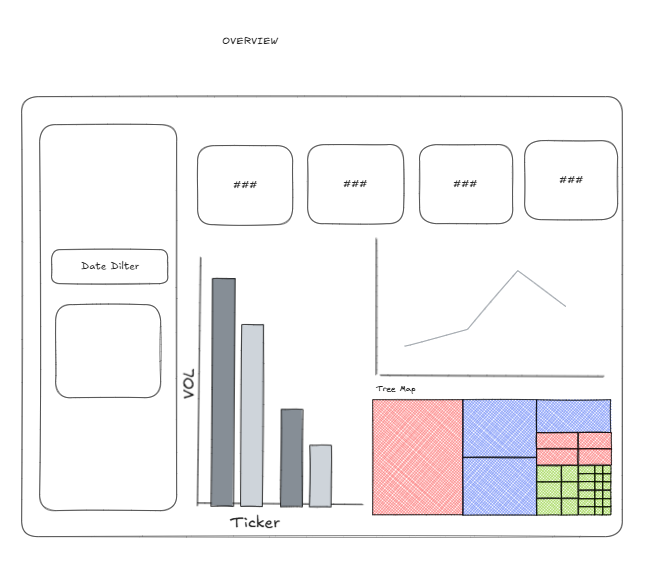
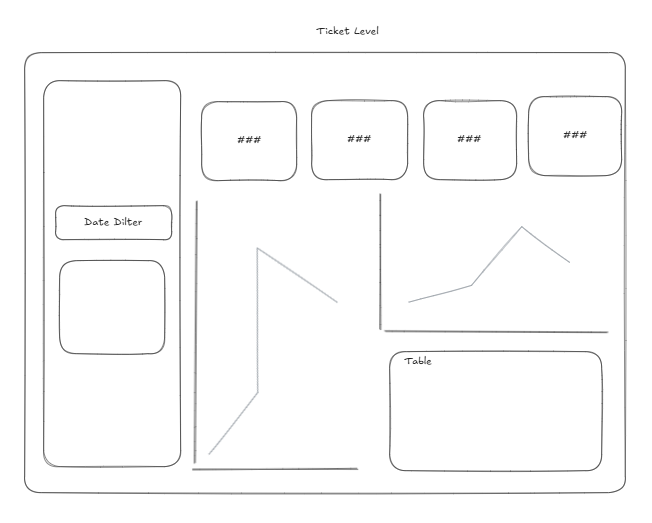
My sketches were therefore very incomplete as I was mainly going with the flow with them.
Finally onto the outputs:
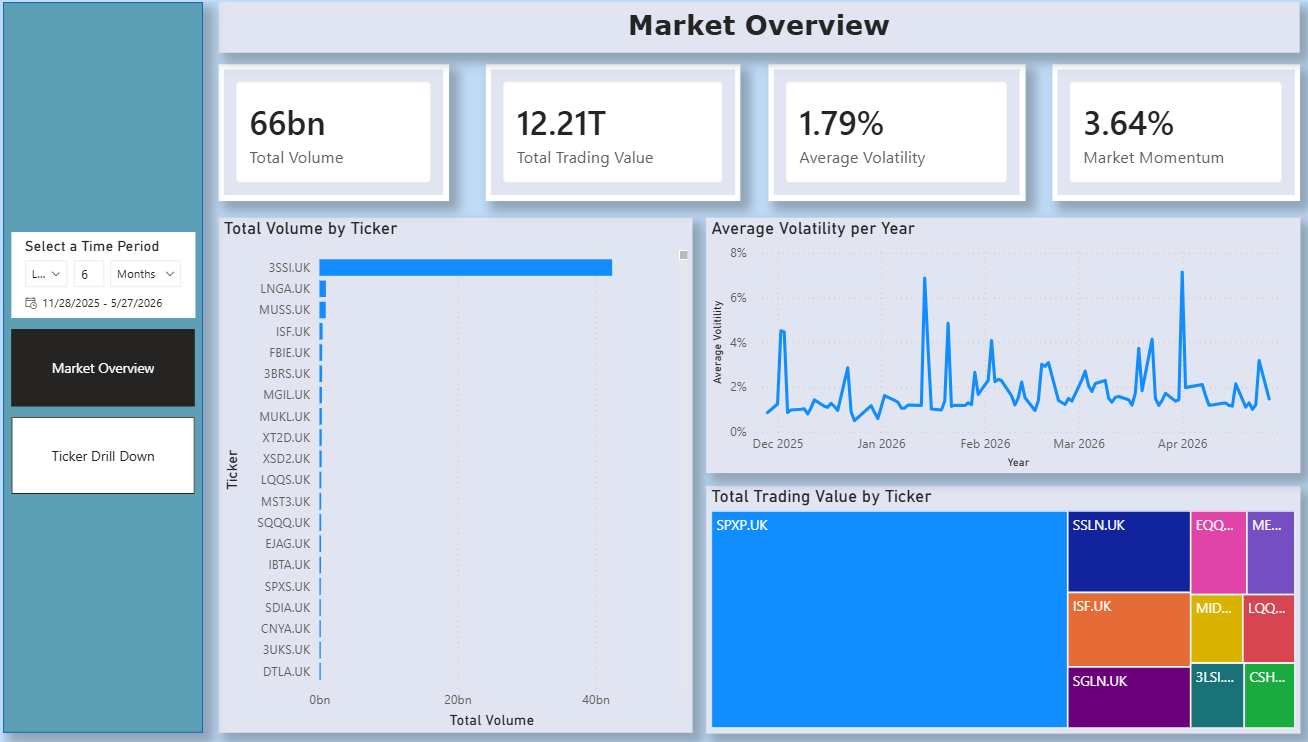
This was my high level dashboard:
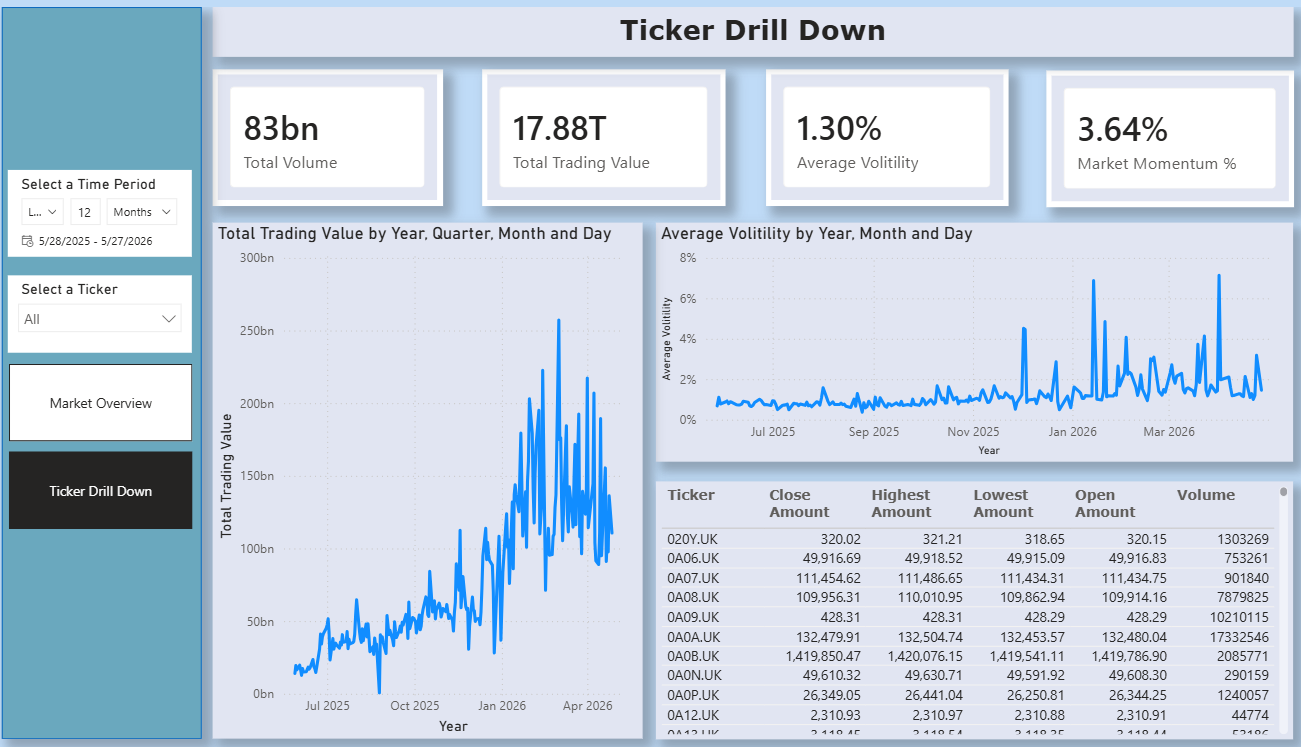
This is my ticker level dashboard:
Descriptions of the Metrics:
Total Volume = The total number of stock shares or ETF units bought and sold over a specific period, showing how much trading activity is happening.
Total Trading Value = The total amount of actual cash moving through the market, calculated by multiplying the traded shares by their transaction prices.
Average Volatility = A metric that measures how drastically and frequently a stock's price swings up and down, indicating the overall risk and stability of the asset.
Market Momentum % = A percentage that tracks the speed and direction of price movements to show whether a stock is gaining strength or losing steam.