


Data is often not stored in the shape we need for analysis. It may be structured for data entry or storage, rather than aggregation or modelling. Pivoting refers to reshaping data so that it can be worked with more effectively. This usually means either converting columns into rows (wide to long reshaping) or rows into columns (long to wide). In Alteryx, the Transpose tool pivots columns to rows, while Cross Tab pivots rows to columns.
Transpose
The Transpose tool pivots columns to rows.
Imagine a table recording the grades that students receive, with a row per student and columns per subject.
| ID | Math | Physics | Chemistry |
|---|---|---|---|
| A | 80 | 75 | 90 |
| B | 70 | 85 | 88 |
While this structure may be convenient for data entry, it makes it difficult to treat "subject" as a variable in its own right.
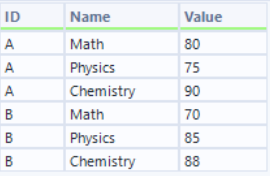
Using the Transpose tool, these subject columns can be converted into rows, giving a table like:
| ID | Subject | Score |
|---|---|---|
| A | Math | 80 |
| A | Physics | 75 |
| A | Chemistry | 90 |
| B | Math | 70 |
| B | Physics | 85 |
| B | Chemistry | 88 |
The student identifier is kept fixed, while each subject becomes a row, with two new fields: one indicating the subject, and the other giving the corresponding value. The result is a longer and narrower dataset where the values from the pivoted columns become a part of the data.
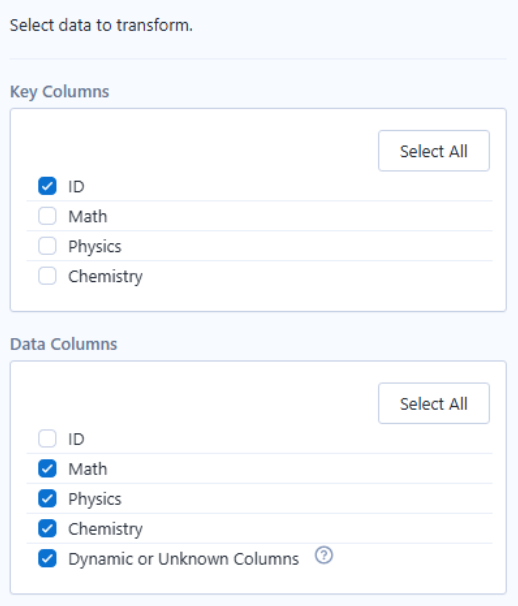
To use the Transpose tool in Alteryx, drag it onto the canvas and connect its input anchor to the output anchor of the preceding tool. In the Configuration pane, Key Columns are those that remain fixed, while Data Columns are those to be pivoted into rows. The headers of the Data Columns become a new "Name" field, and their values are placed in a corresponding "Value" field.
Giving the desired result:
More generally, for a dataset with r rows and c columns, of which ci are identifier (ID) columns (or columns that are not to be pivoted) and cp are pivot columns, applying a transpose operation changes the number of rows to become r × cp. Each original row is expanded once for every pivot column. The number of columns becomes ci + 2. The identifier columns are preserved, and two additional columns are introduced: one for the former column names (the "Name" field) and one for their values.
Cross Tab
The Cross Tab tool pivots rows to columns.
Using a Cross Tab on the output from the Transpose tool above allow us to reconstruct the original, wide format:
| ID | Math | Physics | Chemistry |
|---|---|---|---|
| A | 80 | 75 | 90 |
| B | 70 | 85 | 88 |
Wide formats of data can be preferable for presenting or comparing values across categories side-by-side. In the above case, having subjects as columns makes it easier to compare a student's performance across subjects.
The Cross Tab tool works by taking the values from one column and using them as new column headers, while taking values from another column and placing them into those new columns.
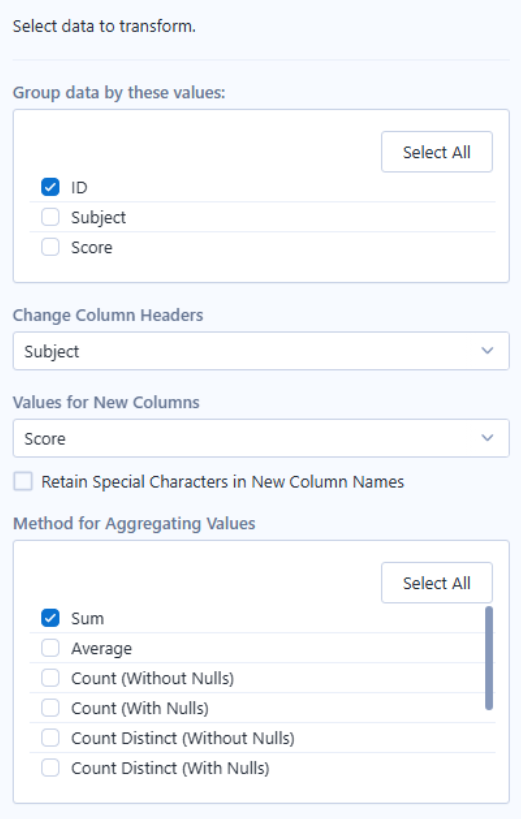
A method of aggregation must be supplied as multiple rows may correspond to the same combination of 'Group by' columns and column headers. In such cases, the Cross Tab tool needs to determine how these values should be combined.
In our example, if a student had multiple entries for the same subject - i.e., if they had taken a test for the same subject at a later date - there would be several values competing for a single cell in the output. An aggregation method (such as Sum or Average) resolves this by reducing those multiple values to a single value.
Overall, the Cross Tab groups data by chosen identifier columns and produces a single row for each. Within each row, the unique values of the selected Column Headers column define the new columns, and the aggregated values fill the corresponding cells.
More generally, if a dataset contains r rows and is grouped by ci identifier columns, forming g unique groups, and the column used for the headers contains k unique values, then the Cross Tab produces a dataset with g rows and ci + k columns.