


Final day, final dashboard (for this week at least).
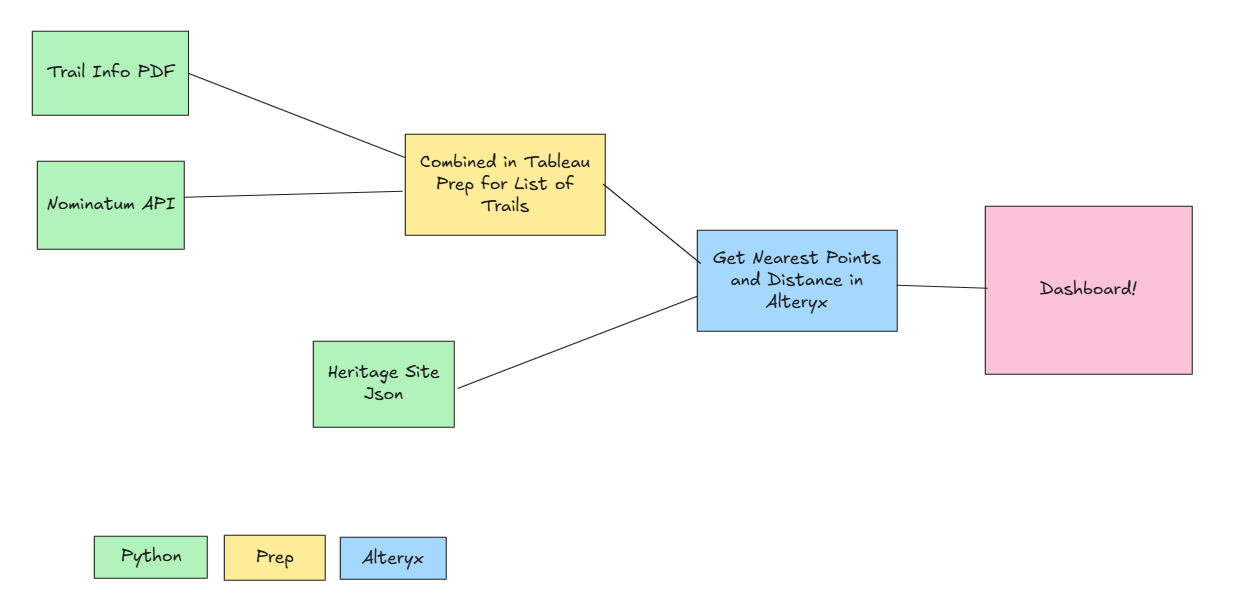
Today's challenge started with a a list of NY State heritage sites and the prompt to find their coordinates and build a dashboard that would allow you to explore them. I had a great time and ended up bring together a whole host of programs from parsing and APIs in python, data cleaning and join with Tableau Prep, spatial calculations in Alteryx and finally, the dashboard itself in Tableau.
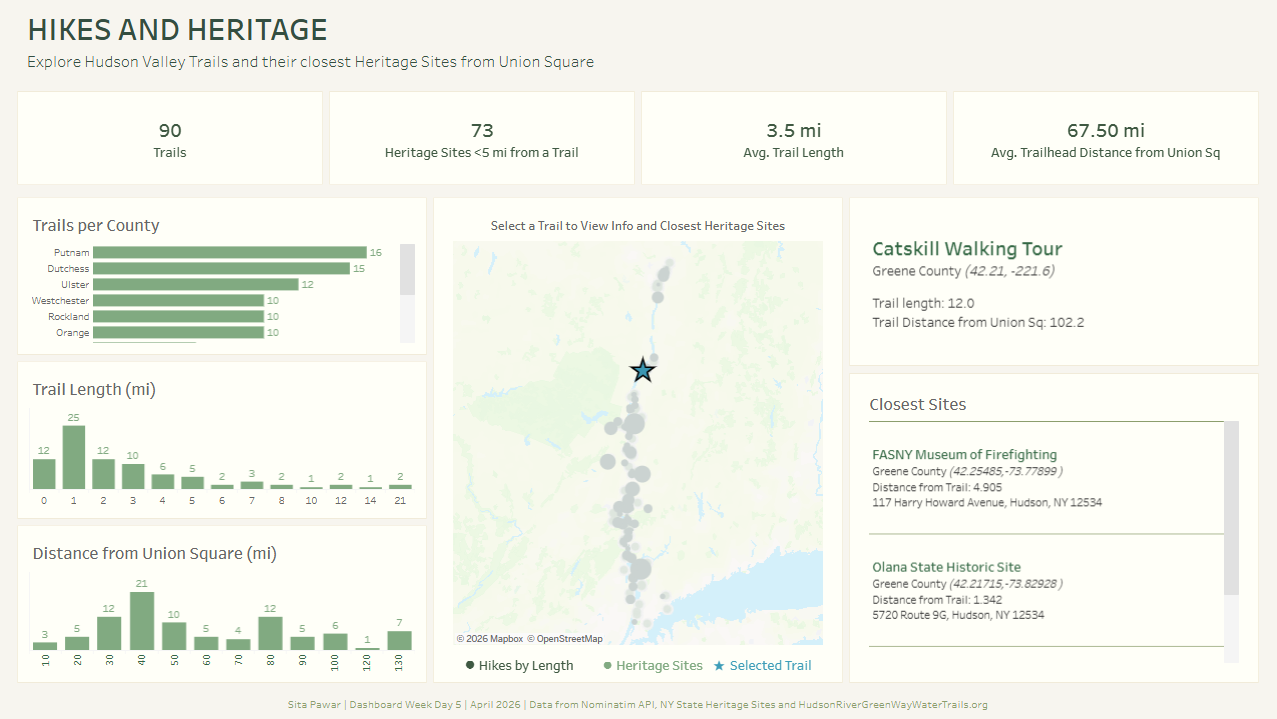
I knew I wanted to look at Hudson River Trails nearby heritage sites since hiking and heritage is my favorite combo.
I got coordinates for around 90 trail heads from an online pdf from hudsonrivergreenwaywatertrail.org and the Nominatim API, which is used for Open Streets. The API took a couple minutes since I made sure to respect the usage limit of a query a second by adding a delay into my code.
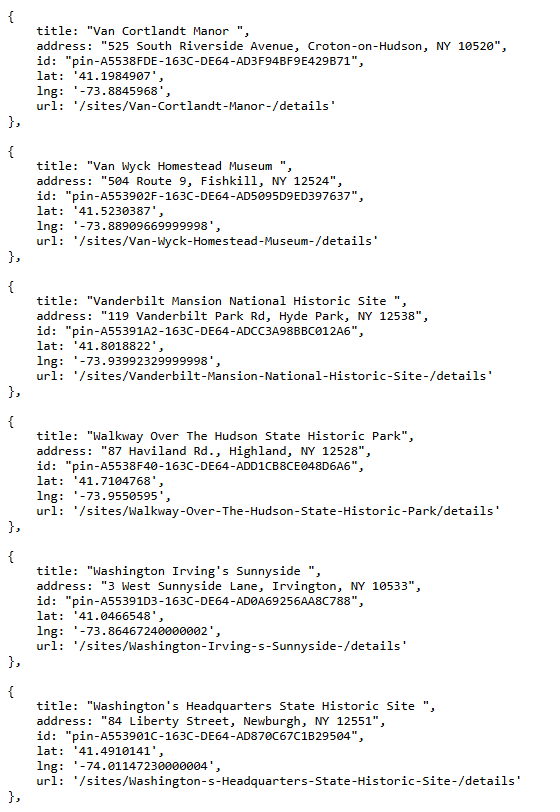
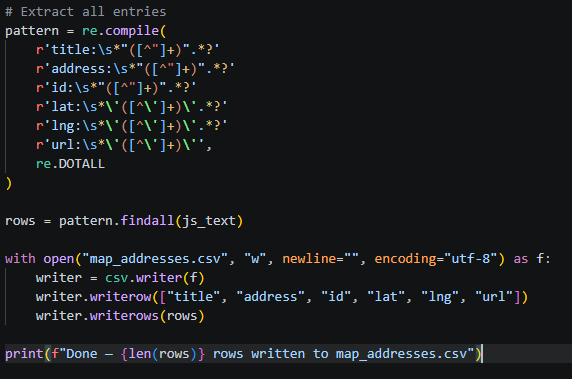
I grabbed the list of Heritage sites by viewing the source code behind the map on the website to grab the JSON list of the sites with coordinates and then I converted it to a csv in Python using Regex.
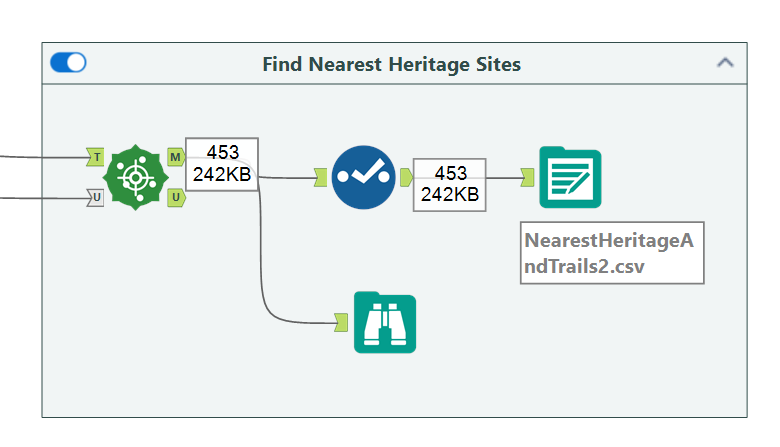
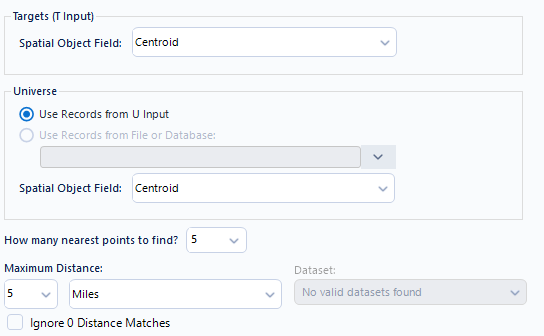
After connecting my two lists of trails (from the PDF and the API) in Tableau Prep, I moved into Alteryx to do some spatial calculations. First I decided to get the distance in miles between The Information Lab and each of the trailheads and Heritage sites. Then, I decided I wanted to focus on what hikes had nearby Heritage sites so, after converting the coordinates to Alteryx Spatial points with MakePoint, I used Find Nearest to get the top 5 closest heritage sites under 5 miles to each trailhead. This is a super useful tool when comparing distances from two different tables since you don't have to cross join and manually calculate every possible distance to find the closest ones– really speeds up the process!
From there I brought the data into Tableau and built a simple dashboard that allows me to explore trails and their nearby heritage sites, considering which are furthest from my office in Union Square. Luckily I finished with enough time to through in some DZV and parameter actions for deeper exploration and cleaner visuals.
That's all for now!