


In my previous post, I broke down where AI is used in Tableau Pulse and what services it provides, including Insight Summaries, semantic matching in "Ask" Q&A, and the enhanced Q&A in Pulse Discover. That post focused on what users actually get from the output of the AI.
In this post, I want to go one level deeper and explain how that AI fits into the overall system architecture — and more importantly, how it produces the output that users see.
At a high level, the insights you see in Tableau Pulse follow this flow:
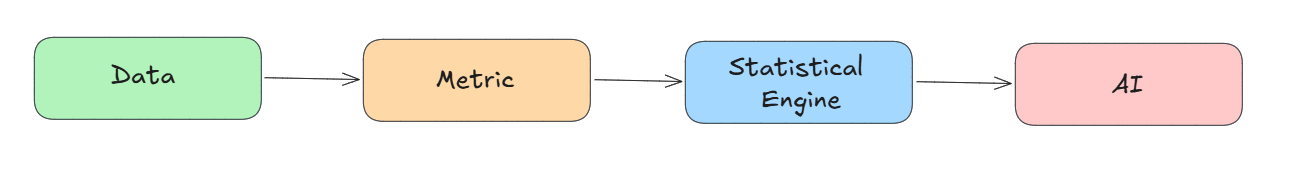
Tableau Pulse is built on a layered pipeline that transforms raw data into insights and then (optionally) into AI-powered explanations. Each layer plays a distinct role, and importantly, AI does not operate in isolation on raw data, but on a combination of outputs from all of these layers.
Data (raw input layer)
The pipeline begins with the published data sources in Tableau Cloud. This is the raw foundation of everything in Pulse. The data must include at least one measure and a time or date field in order to support metric tracking.
For example, I used the Sample Superstore dataset with shifted dates and published it as a data source in Tableau Cloud.
Metric (semantic definition layer)
The metric layer defines the Pulse metric. It is what you define when you create a metric, such as:
- the measure itself (e.g., Profit, Sales)
- the time dimension (e.g., Order Date)
- aggregation logic (Sum, Average)
- dimensions (Category, State, Segment)
- filters
- formatting such as currency or custom labels
- optional trends, comparisons, and goals
This layer defines what metric to track and what kinds of changes might matter.
Statistical engine (insight generation layer)
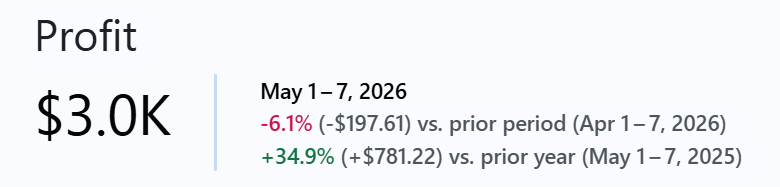
Once metrics are defined, Tableau applies a statistical engine to analyze the data and detect meaningful changes. This layer uses deterministic statistical models to generate facts like:
- Profit is down 6.1% this month
- Compared to last month, Profit decreased by $197.61
- 30 out of 60 cities showed a decline in Profit this month
(The facts will not be in the exact format above, this is just an example of the insights that can be made from the facts)
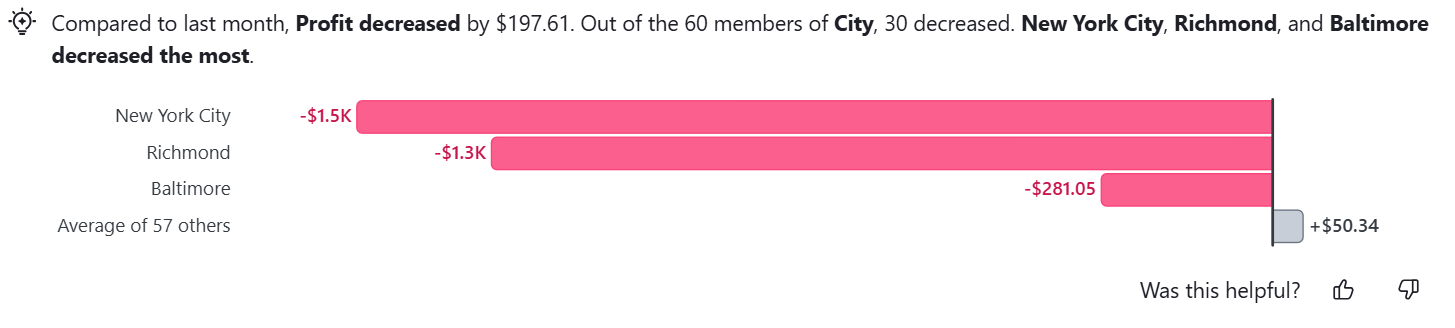
These facts are computed directly from the metric definitions and are not generated by AI. That is why users can still see insights like below and use the Ask Q&A experience even when AI features are turned off.
Importantly, insights are also ranked based on impact to the metric. Each fact is scored by how much it impacts the metric value, and only the most statistically significant insights are surfaced first. At this stage, the system has transitioned from raw data into structured analytical output — it now knows what changed, how much it changed, and how important that change is.
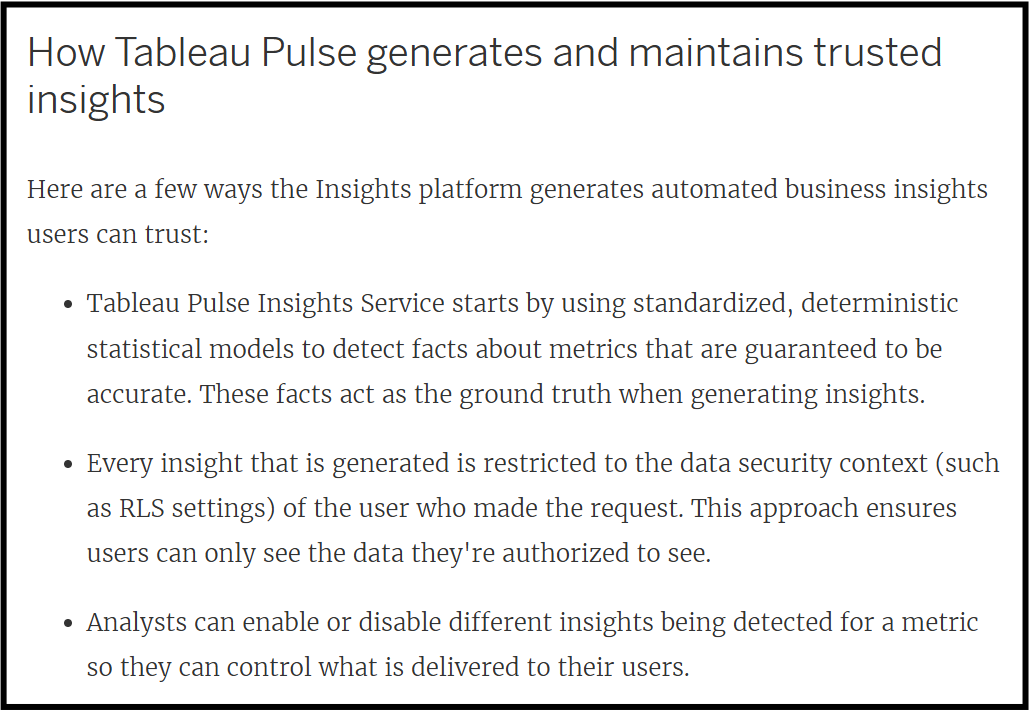
You can learn more about how insights are generated here:
AI layer (grounded reasoning and language layer)
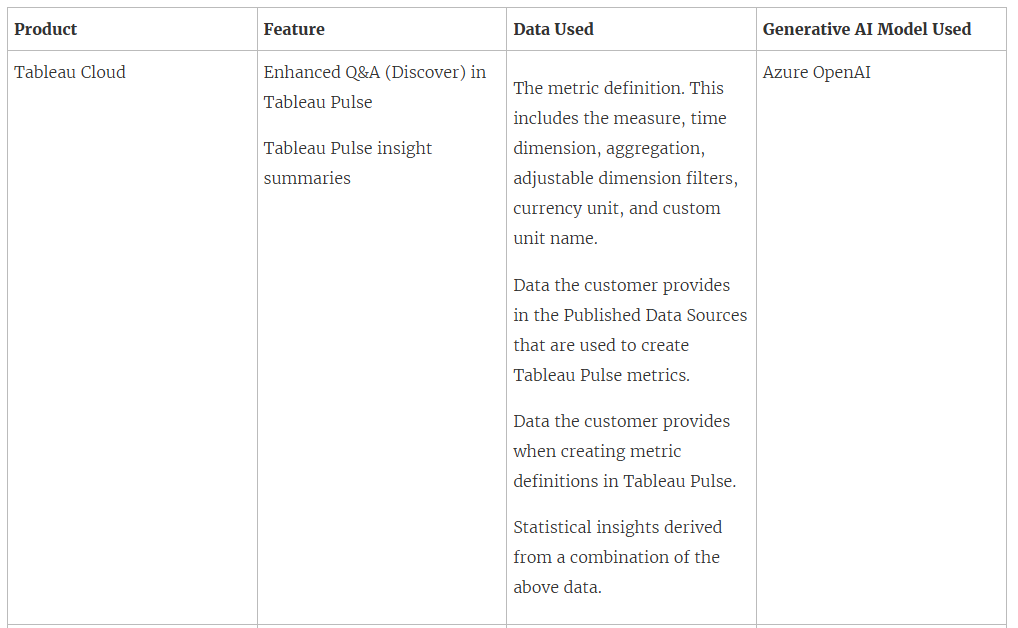
Only after structured insights are generated does the AI layer enter the system. However, it is important to understand that AI in Tableau Pulse uses data from:
- metric definitions
- data from published data sources used to create Pulse metrics
- data used to create metric definitions
- statistical insights derived from a combination of the above data
This is outlined in Tableau’s documentation on AI and data usage here.
However, from what it seems, because the statistical insights are themselves generated using all of the data above, the AI layer that consumes those statistical insights also indirectly “uses” all of that context as well.
Although some of the other information — such as metadata and text definitions provided when creating metrics — might also be fed into AI to improve performance, the statistical insights appear to be the primary driver for what gets fed into the AI system.
As Tableau puts it for Insight Summaries, “the most relevant facts are processed by AI in Tableau. These facts are used as ground truths to contextualize language generation” (source). This suggests that the AI is primarily grounded on the structured outputs generated by the Insights platform, rather than independently analyzing raw data itself.
This was the breakdown of how AI in Tableau Pulse functions — at least for now. Both AI and Pulse itself are evolving rapidly, with new features and updates being introduced frequently, so expect parts of this architecture and user experience to continue changing over time.