


There are 4 stages to completing the Data School application.
The first stage of the process is to create a Tableau dashboard using a dataset of your choice. During this process, you can receive feedback on your dashboard from members of the Information Lab. If all goes well, you move on to the second stage—an online interview, which begins with a five-minute presentation of your dashboard.
If you pass the interview, the third stage is very similar to the first, except this time you are given a dataset and asked to build a dashboard within a set timeframe of around ten days. The final stage is an in-person interview that also begins with a five-minute presentation of your dashboard.
In this blog post, I am going to talk about my experience and tips on the first stage.
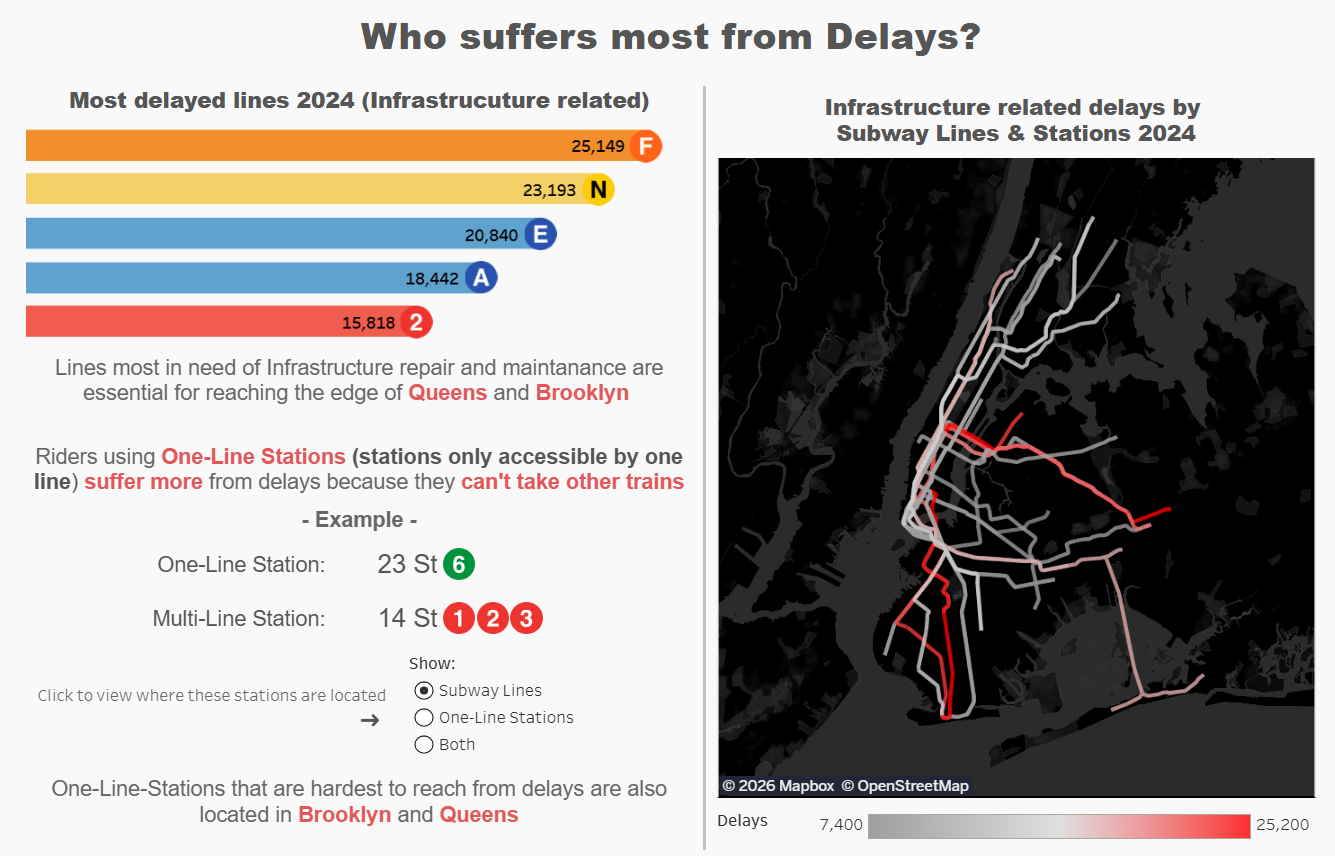
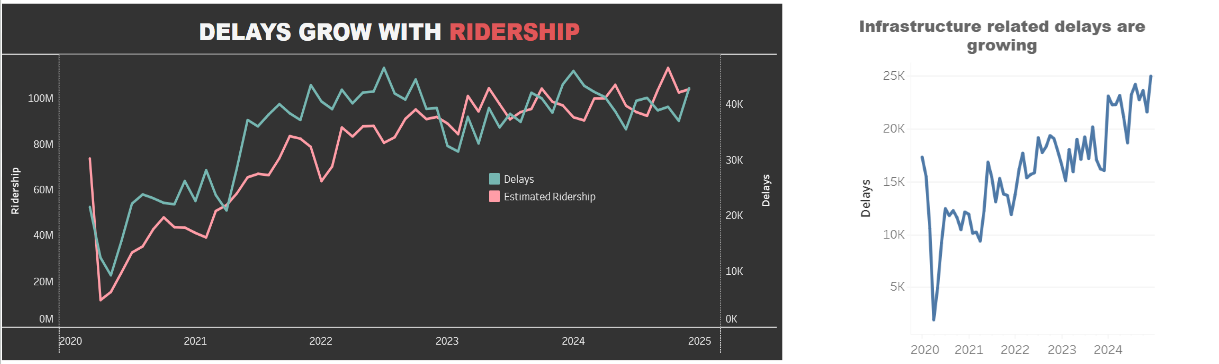
For my first dashboard, I used New York City’s subway data to create a visualization focused on subway delays. I had no prior experience with Tableau before starting, so this stage involved learning a lot about what Tableau can and cannot do.
A common piece of advice I came across when learning Tableau is to use a dataset you are already familiar with—something that you might have experience working in other software or programs. Personally, I think what matters most at this stage is choosing a dataset you are genuinely curious about. The early stages of learning always come with challenges and mistakes, and motivation and curiosity can help push you through them. If working with the dataset feels fun, it becomes much easier to stay engaged and not give up.
Another tip for anyone starting out with Tableau is to binge Andy Kriebel's videos. He has a playlist called Tableau Tips, which is incredibly helpful. There is a lot of value in simply skimming through the videos—or even just their titles—to get a sense of what’s possible in Tableau. Once you understand what the software can do, you can decide what to try and what to leave aside. Becoming aware of Tableau’s capabilities is a great first step.
With that said, here are my top 3 tips that I received as feedback on my application that may help you with yours as well.
- Consider the Audience
Make your dashboard with a clear purpose. Think about who your audience is and what you want them to take away from the data. Aim to convince or persuade them of something by presenting your insights in a deliberate and thoughtful way. After you explored your dataset, I recommend checking out this blog by Bianca Ng to help plan the structure of your dashboard. - Concise and Clear Text
Avoid long paragraphs and focus on communicating insights clearly and briefly. Let your visualization do most of the talking. If you find yourself writing a lot of explanatory text, consider whether some of it could be communicated visually instead. - Color Choice and Accessibility
Use color with intention and consistency. Avoid assigning multiple meanings to the same color—for example, if green is used to show positive performance, don’t use it elsewhere to represent availability. Instead, treat color as a label: if you use red to highlight danger, use a different color, such as orange, to highlight high expense. Also be mindful of color blindness - check out this blog by Nadia Holloway that is very helpful.
My final tip for the first stage is to submit your dashboard to The Data School early. You can receive three rounds of feedback, and after each round your dashboard may change drastically. Submitting early gives you time to incorporate the feedback and make improvements. Even if your dashboard isn’t perfect, submit your initial draft early. Reviewers will be handling many dashboards near the deadline, so early submission will be appreciated. Don’t worry too much about small details, like a few pixels of spacing, in your first submission—chances are you’ll be reworking your dashboard anyway. You can save those finer adjustments for later submissions. I had only about two weeks of Tableau experience when I made my very first submission. At the time, I didn’t feel ready, but looking back, I wish I had submitted even earlier.
And finally—have fun with your dashboard! Try to create something that excites you, because chances are the reviewers will find it interesting too.