


For Day 1 of Dashboard Week, we were tasked with exploring London’s cycling infrastructure using live data from Transport for London’s Bike Point API.
The brief was to use Alteryx and Tableau to transform real-time Bike Point data into an interactive dashboard that helps users plan cycling journeys across London. The key challenge was to answer four critical questions for any rider:
- Which stations are near my start point?
- Do they have bikes?
- Which stations are near my destination?
- Do they have empty docks?
My Approach
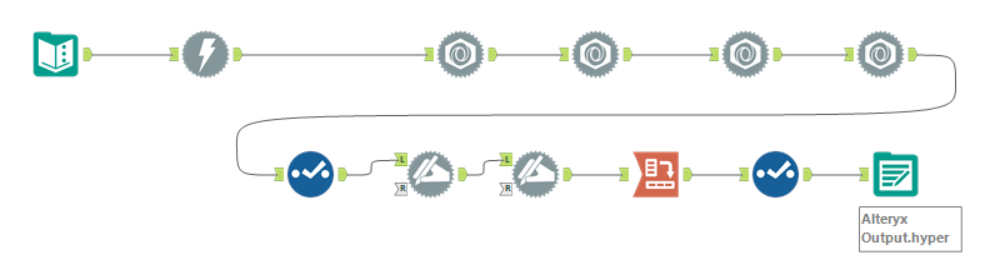
Data Prep (Alteryx)
I sourced my data directly from the TfL Bike Point API using Alteryx. The workflow involved connecting to the API, parsing the JSON response to extract station names, coordinates, and real-time bike/dock counts, and cleaning the data types for spatial analysis.
Building the Dashboard (Tableau): The biggest challenge was the user interactivity for selecting locations. A standard map in Tableau allows users to click existing data points (bike stations), but I wanted users to be able to plan a journey from anywhere - even if they weren't standing right next to a docking station.
To solve this, I created a hybrid selection tool:
- Map Selection Mode: Users can toggle between "Start" and "End" modes and click directly on station dots to auto-fill coordinates.
- Manual Input Tool: I added parameter text boxes that allow users to type precise Latitude and Longitude coordinates. This effectively turned the dashboard into a "web app," allowing for precise journey planning from home addresses or offices.
I used Tableau’s spatial functions (MAKEPOINT, MAKELINE, and BUFFER) to visualise the route and draw a radius around the selected points, determined by the max distance the user would like to walk to find a bike (also controlled via a parameter). This spatial filter drives the bar charts at the bottom, which update dynamically to show only the relevant stations.
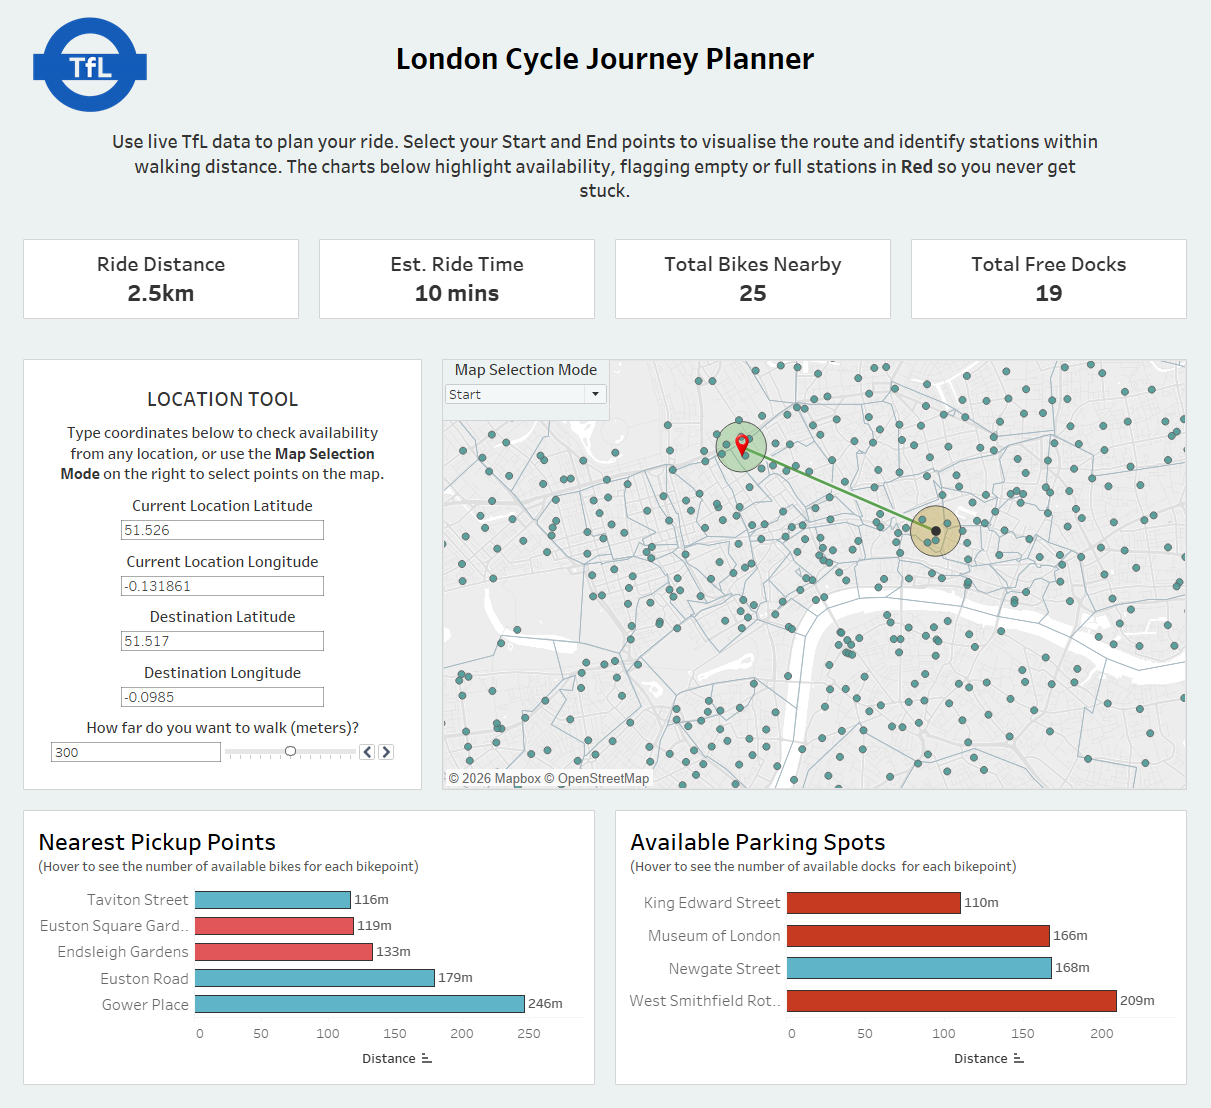
The Final Dashboard
Here is the finished product. I opted for an "application-style" layout, with a dedicated input sidebar on the left and a KPI layer at the top for instant journey stats (distance, ride time, and total availability).

Reflection / Things I Learned
- From "Dashboard" to "App": Initially, I struggled with the logic of only allowing users to click existing stations. I didn't want the user to rely on manually typing in coordinates for their desired locations, however being able to pick only those bikepoints already on the map is problematic in itself - what if a user isn't standing directly near a docking station? They wouldn't be able to select their location. The solutions I settled on were okay, however if I wasn't restricted for time I would add another map layer of map points for each coordinate across London as makepoints and make them transparent. Then, a user could click anywhere on their map of London and set that invisible point as their current location/destination.
- The "Zero Bar" Problem: I initially struggled with how to visualise the nearest station. If a user selects a station as their starting location/destination, the distance is 0m, which meant the bar chart effectively hid the best option as that station is technically the closest. I solved this by adding the option to manually enter latitude and longitudes, as these won't overlap with any bikepoints. Note that this issue wouldn't arise with my map solution in the point above.
- Red means "No-Go": I realised that telling a user a station is "Close" isn't helpful if it's empty. I added a strict color rule where 0 Bikes or 0 Docks turns the bar bright Red. This visual cue saves the user time by immediately flagging invalid options, regardless of how close they are. However, I could have made this more clear by adding a colour legend, which I overlooked during the last dashboard formatting.