


If you've ever opened a dataset and felt that quiet dread of staring at 50 columns and 10,000 rows wondering where to even begin, asking questions like:
- Is Sales at the row level or already aggregated?
- Why does Customer Name appear multiple times?
- Which date should I even use?”
Then this series is for you!
We're going to use one of the most beloved practice datasets in the analytics world, the Superstore dataset! So we can get a walk through on data modelling from the ground up.
Let's start at the beginning.
What Even Is Data Modelling?
Data modelling is the process of deciding how your data should be structured, organized, and connected. Think of it less like a technical task and more like interior blueprints of a home, you're figuring out where everything lives, how rooms relate to each other, and how someone can navigate the space without getting lost.
For a data analyst, a well-modeled dataset is understanding why a dashboard is reliable vs one that randomly double-counts revenue and not knowing why this is happening. It matters a lot and having this knowledge can you give you better grasp in handling future datasets seamlessly.
Hello Superstore Dataset!
If you haven't worked with Superstore before, here's a quick explanation: it's a fictional retail company selling furniture, office supplies, and technology products. It covers orders, customers, products, shipping, and geography, basically everything you'd encounter at a real e-commerce or retail company, in a clean, approachable package. If you have a hard time navigating through Tableau to retrieve the Superstore dataset you can find it in this link.
https://public.tableau.com/app/learn/sample-data
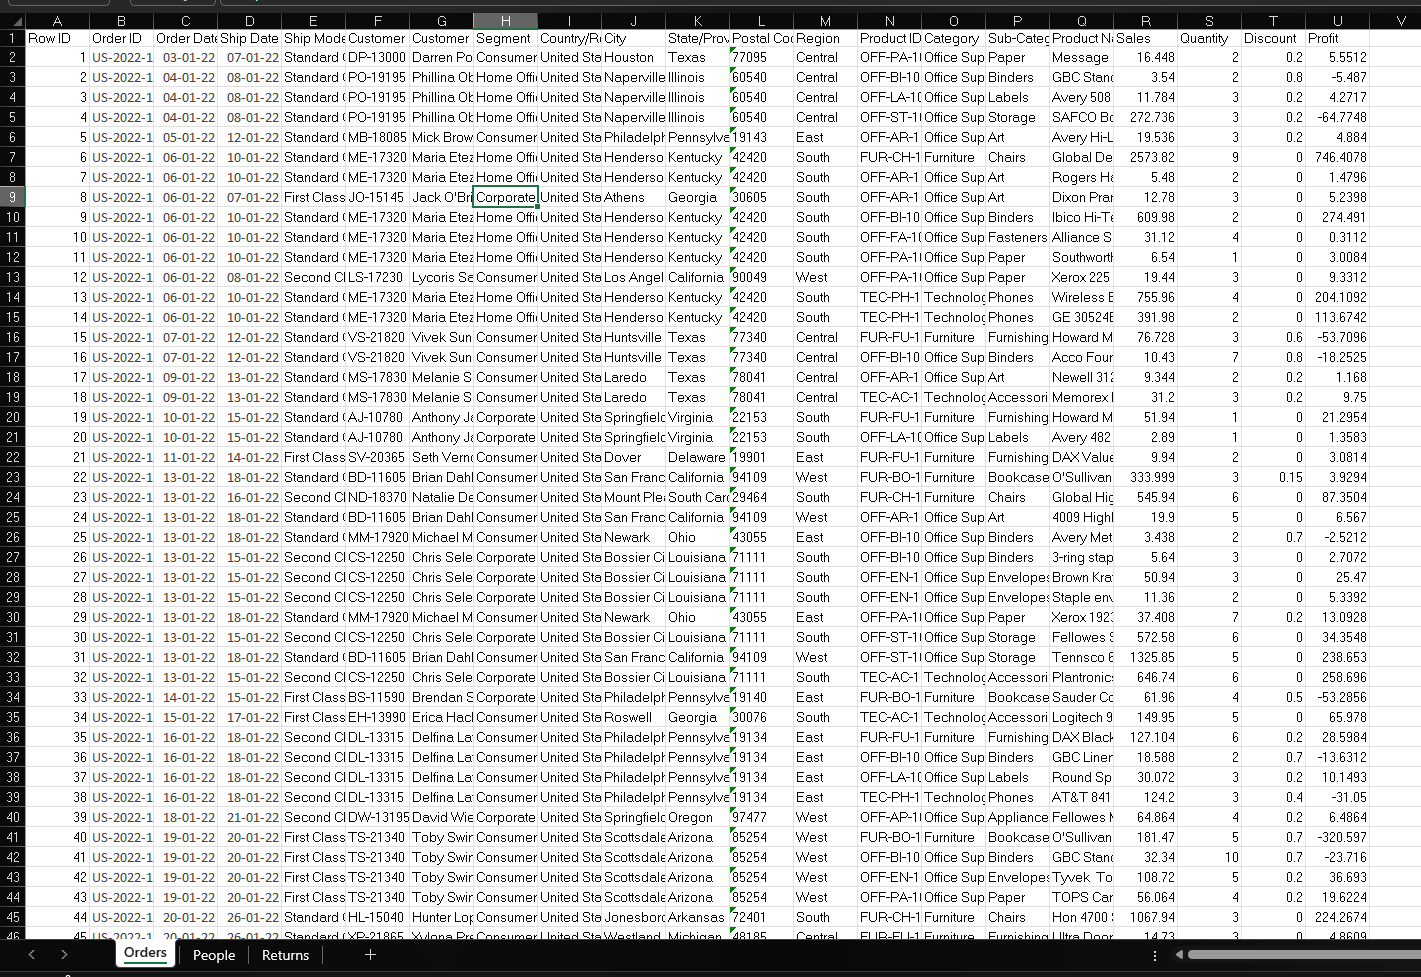
The Problem with One Big Spreadsheet
When most people first get data, it comes in exactly this format, one flat table with everything in it. But the moment your data grows, multiple people need to work with it, or you want to build something reusable, the flat file starts showing its cracks.
Here's a concrete example straight from Superstore. Every single time a customer places an order, their chosen shipping method, First Class, Second Class, Standard Class, gets written out in full on that row. Now look at Category. Every time a product gets ordered, "Furniture" or "Technology" or "Office Supplies" gets repeated again. And again. And again.
These cracks create problems. Why?
- Repeated values create inconsistencies - “Standard Class” and “standard class” might look the same to us, but the data sees them differently.
- Updates become risky - changing one business term means finding and updating every row where it appears
- Files get larger than they need to be - the same customer, product, and shipping details are stored again and again
- Dashboard can slow down - larger messier tables can make queries and refreshes less efficient.
- Metrics are easier to break - joins and aggregations can accidentally duplicate rows or double-count values
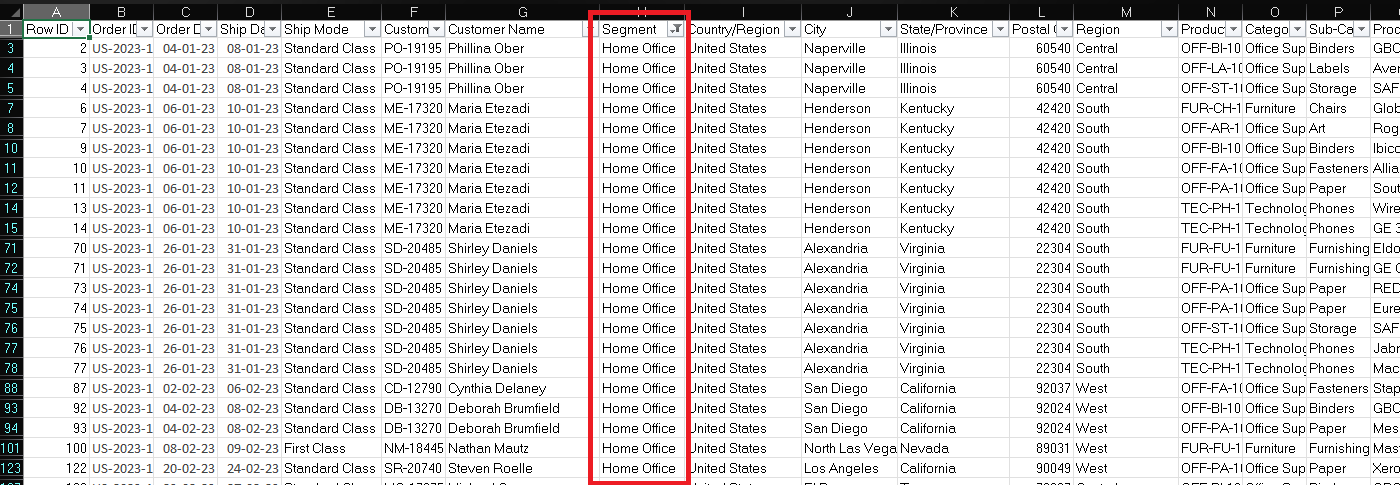
For example lets say the business rebrands "Home Office" as "Remote Worker" across their customer segments. In a flat file, that's not one update, that’s tracking down every single row where Segment says "Home Office" and changing it. Miss a few, and now your data tells two different stories depending on which rows you happen to query. This is called an update anomaly, where modifying a piece of information requires updating multiple rows, and it's one of the core problems that data modelling exists to prevent.
Thinking in Entities
The first real skill in data modelling is learning to look at a flat dataset and ask: what are the actual things being described here?
In the Superstore dataset, if you look carefully, you'll notice the data is really talking about several distinct entities, things that have their own identity and attributes:
Orders are the core transaction. An order has a date, a ship mode, a sales amount, a discount, a profit. It happened once, at a specific moment.
Customers are the people placing those orders. A customer has a name, a segment they belong to (Consumer, Corporate, or Home Office), and a location. They exist independently of any single order.
Products are what's being sold. Each product belongs to a category and sub-category, has a name, and carries a product ID. A product exists whether or not anyone bought it this month.
Geography, city, state, region, postal code is really its own dimension. Location data describes a place, not a transaction.
Right now in the flat file, all of these entities are collapsed into a single row. Data modelling is the practice of pulling them apart and giving each one its own home.
Why Analysts Need to Understand This
You might be thinking: I’m an analyst, not a data engineer. Isn’t this someone else’s job?
In larger organizations, data engineers or analytics engineers usually own the modelling layer. But analysts who understand data modelling make better decisions every day, even when they are not the ones building the models.
Understanding how a table is structured helps you avoid common mistakes, like writing joins that accidentally duplicate rows and inflate your numbers. It also helps you understand the grain of the data, so you don’t double-count revenue, customers, or activity. When you open an unfamiliar database, you can quickly work out what each table is doing and how the tables relate to each other.
It also makes collaboration easier. If a dashboard looks wrong, you can have a clearer conversation with an engineer about whether the issue is coming from the data model, the join logic, or the calculation itself. In the end, understanding data modelling isn’t about building pipelines, it’s about trusting the numbers you work with.
What's Coming in Part 2
Now that we've established what data modelling is, why the flat file breaks down, and how to start seeing entities in your data, Part 2 is where things get structural. We're going to break the Superstore dataset apart into proper tables, and introduce the two concepts that hold the whole thing together: Primary Keys and Foreign Keys. We'll draw out the actual relationships between Orders, Customers, and Products, and show exactly how a join works under the hood.
If you've ever been questioning what a key actually is, or why it matters, Part 2 is going to make it click.