


We've recently learnt about VAR in Power BI which is used to create a variable.
Variables let you create/store a calculation or a value and you can reuse it later in the same formula. They can also be written very clearly and logically in the measure which makes it easier to read and follow what it's doing.
For example if we wanted to use VAR for a control chart we would need to write measures for
- Average sales
- Standard deviation
- Upper bound measure
- Lower bound measure
- Conditional formatting
which could potentially mean lots of functions to keep track of.
Instead we can use VAR to create variables for average sales and the standard deviation, and then use those to work out the upper bound.
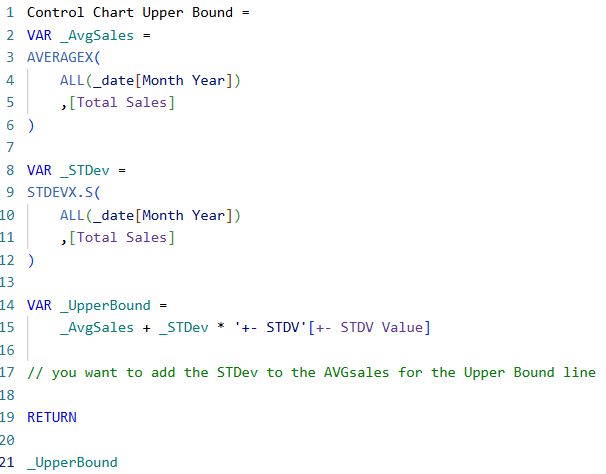
This is what the DAX looks like for that, it's written out clearly and it's easy to follow!
If we tried to do this without the variables, the logic still makes sense but it's less easy to read.
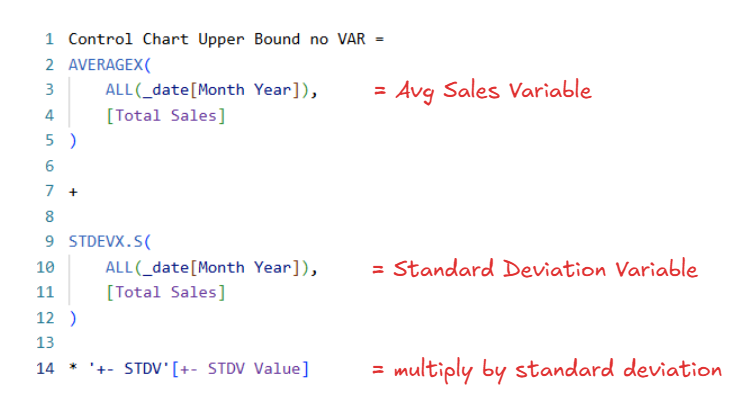
So having the AVERAGEX + STDEVX.S all in one makes it hard to see what it's doing just at a glance; there's also no clear names to describe the logic of this measure; and lastly, it's harder to troubleshoot if something isn't working correctly.
With the VAR you can check the results by temporarily returning the variable you want to check. This helps you isolate where exactly is the issue just by replacing the "Return" line.
In this example, we're checking our variables by changing what's being returned. You can see the latest year and previous year variables are returning the same value - telling us one of those is wrong. We can then look into both and see that for the previous year, it's missing the minus 1.