


Wow it's week 4 already!
This week has been a big Tableau week for us, we've just had two sessions about Sets and Parameters which may or may not have broken our brains a little bit but that's what this blog is about.
Sets
Sets are custom fields in Tableau that define a subset of your data based on certain conditions. It’s easy to spot a set in the data pane as it’s represented by a Venn diagram, which it’s helpful for remembering you’re grouping things.
There are three main types of sets:
Constant Sets - Members of the set are fixed and do not change unless you manually update them.
Computed Sets - Members of the set are dynamic so they will change automatically when the underlying data changes. There are three types of computed sets: general, condition, and top.
Combined Sets - Two existing sets that are combined to make a new set and you can compare the members. This is only possible if the two sets are based on the same field though.
Example: “Top 10 Restaurants by rating” AND “Restaurants within 1km of the Royal Albert Hall” this new set contains only restaurants that meet both criteria.
1 - Constant Sets
So in this example we're adding pizza ingredients into a constant group - this has to be manually changed.
The first steps are to choose which ones you'd like to group
→ then find the Venn Diagram to add it to a set and name the set
→ then you can add it to the sheet, add it to the filters, or add it to the colour marks card.
2a - Computed - General Sets
So continuing on with our pizza example, we've created a set that again involves choosing pizza topping ingredients however General Sets are dynamic so in this case, the user can select whatever pizza toppings and that changes the view.
First create a set and name it
→ then you can add it to colour or the detail marks card
→ then you can show set and optionally add it to the rows
After this, you can see that if you select a different topping, the view automatically updates!
2b - Computed - Condition Sets
This condition set helps us determine which ingredients are less than or equal to £1.50.
After creating the set and naming it we can choose "Condition"
→ then select by field
→ then select less than or equal to and enter 1.50
→ then you can add it to colour/rows etc. and you can easily spot which ingredients are under £1.50
2c - Computed - Top Sets
For Top Sets you can either use the Top X or Bottom X. For this example it's just the bottom 10 products by the price as this will highlight the 10 cheapest options.
So just like the other examples start by creating the set, naming it and this time choose "Top"
→ select by field
→ then change from 'Top' to 'Bottom' (it's already set to 10)
And then after adding to colour/rows it'll display the 10 cheapest ingredients.
3 - Combined Sets
Combined Sets will combine two sets that are based on the same field. With our pizza toppings dataset, that shared field is the 'Product' which is the pizza toppings/sauce/size etc.
So for this set you start by selecting your two sets that you're trying to combine, then
→ select 'Create Combined Set'
→ choose from the list of options that combine the members of each group in different ways
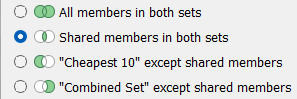
in this example we chose the second option where the members match the criteria for both sets (in this case they would be the 10 cheapest ingredients AND less than or equal to £1.50)
→ then add the combined set in and you can view which ingredients are part of both sets
Parameters
A parameter is a value that can be changed by the user while interacting with a view, rather than relying on a fixed constant. Parameters allow users to control how a visualisation behaves, making dashboards more interactive and flexible.
Parameters can be used in several ways, including:
- Creating user-controlled thresholds
- Supporting what-if analysis
- Building dynamic fields, axes, or titles
- Filtering across multiple or unrelated data sources
- Selecting Top N values dynamically
We can use parameters quite easily in Tableau:
- Create the parameter
- Use it within a calculated field, reference line, set, or filter
1 - Measure Reference Line
First create a parameter and change the data type to integer (you can also change allowable values to list/range if you don't want the user to be able to just type in anything)
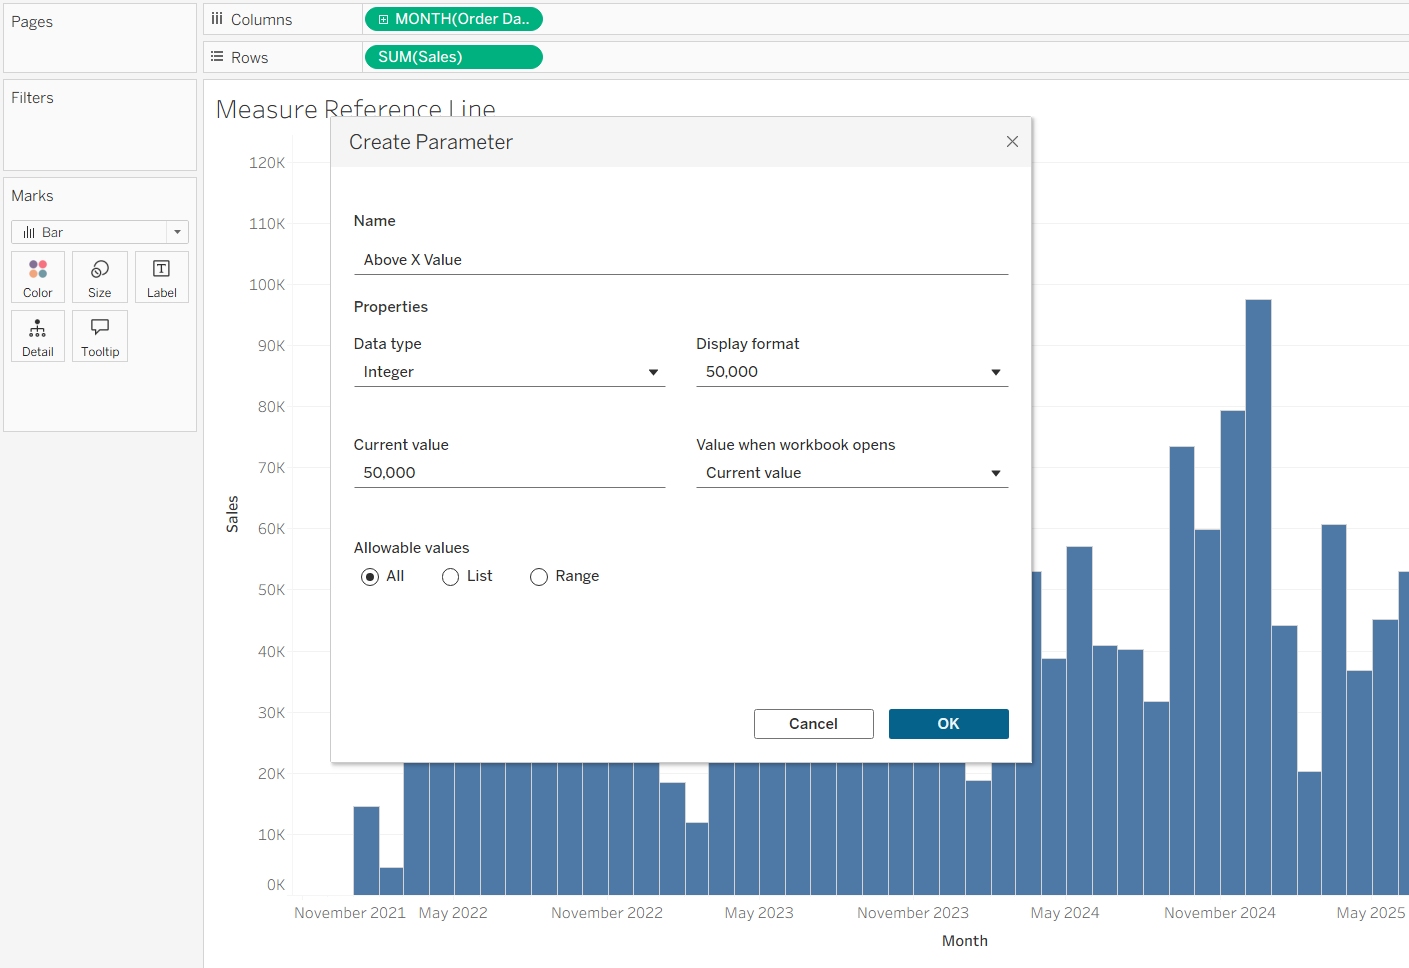
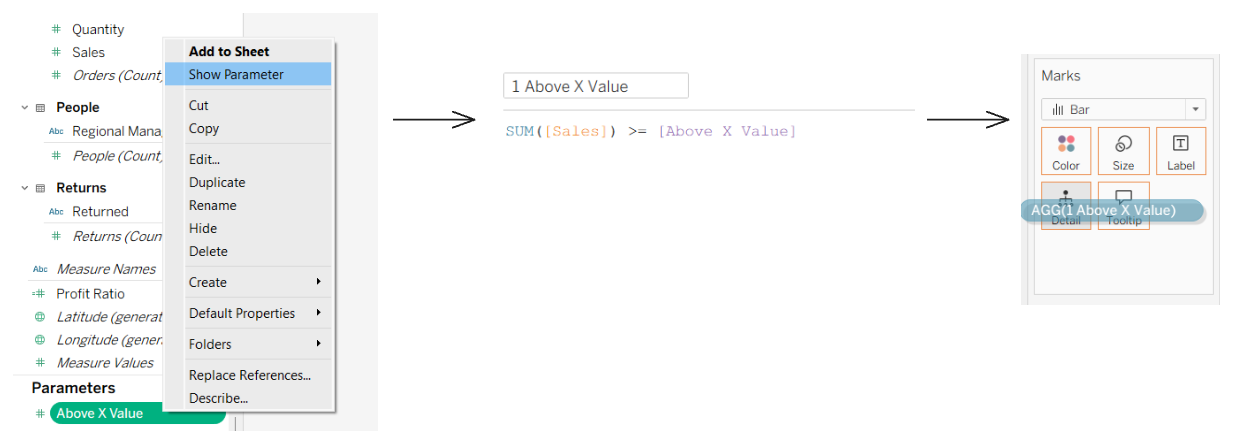
Next 'Show Parameter' → and create a calculated field → then add it to the details marks card. (Optionally, you can also add it to the colour marks card)
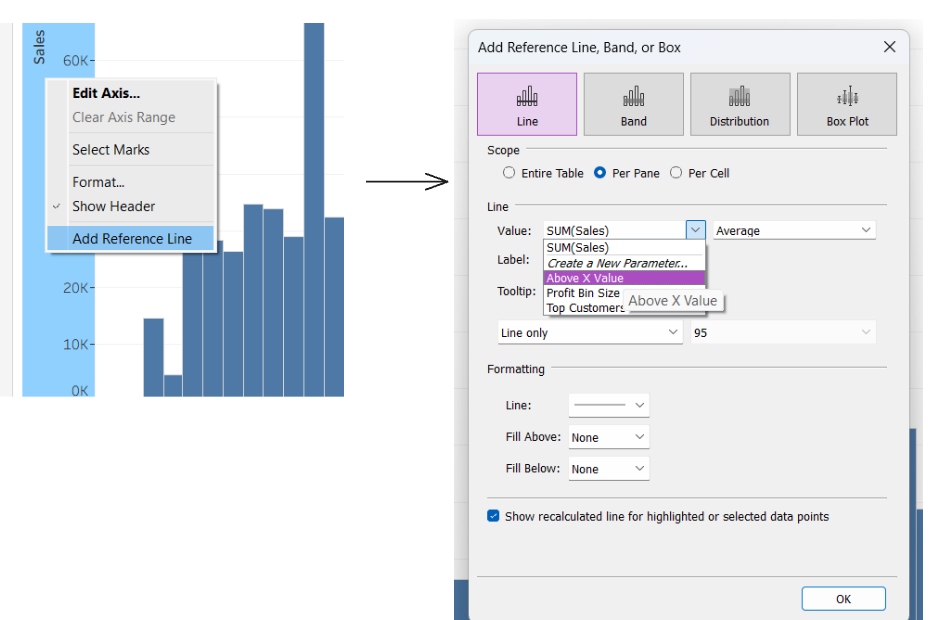
Lastly add the reference line by right-clicking on the axis and choosing your parameter.
You should end up with an interactive parameter that let's you control the reference line.
You can also add a Parameter Action → choose "Change Parameter" → and then under 'Target Parameter' choose your parameter
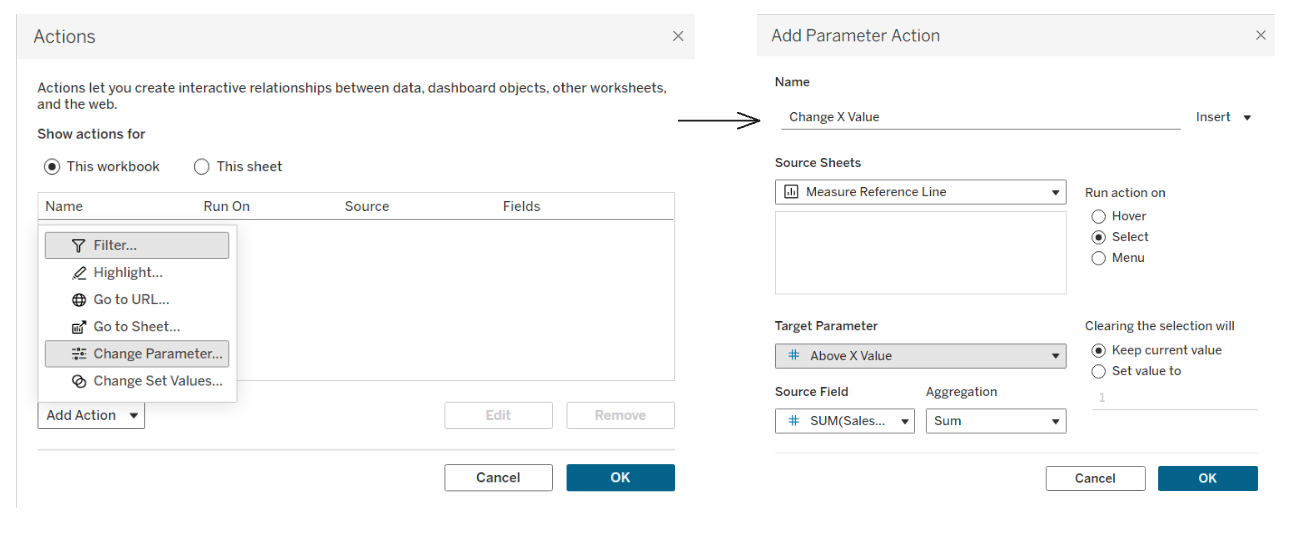
And this makes the reference line change with whatever value is clicked! So much interactivity :)
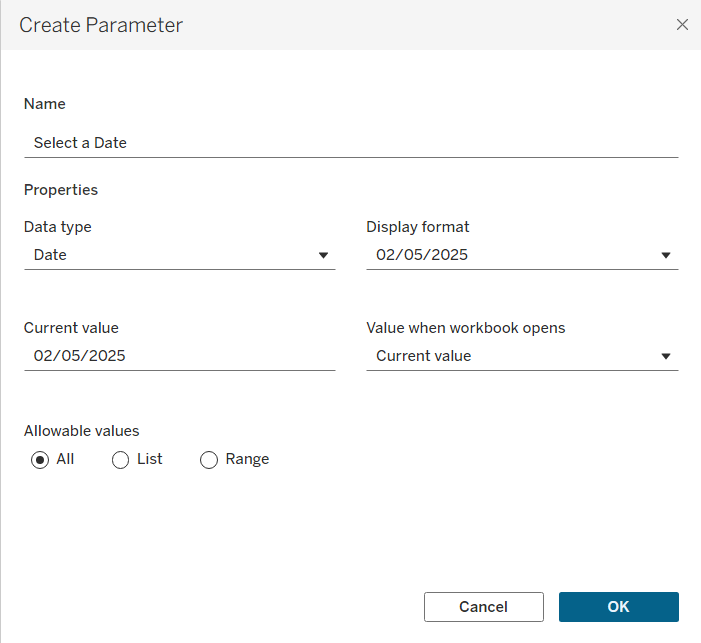
2 - Date Reference Line
So this time when we create the parameter we're going to change the data type to a date.
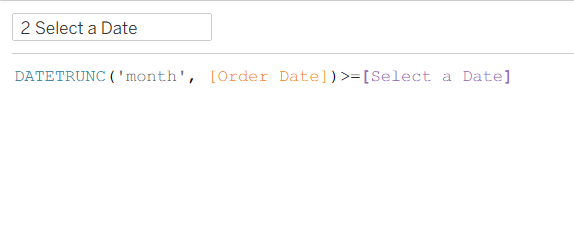
Then we want to create a calculated field → add this to the marks card under detail or colour or both
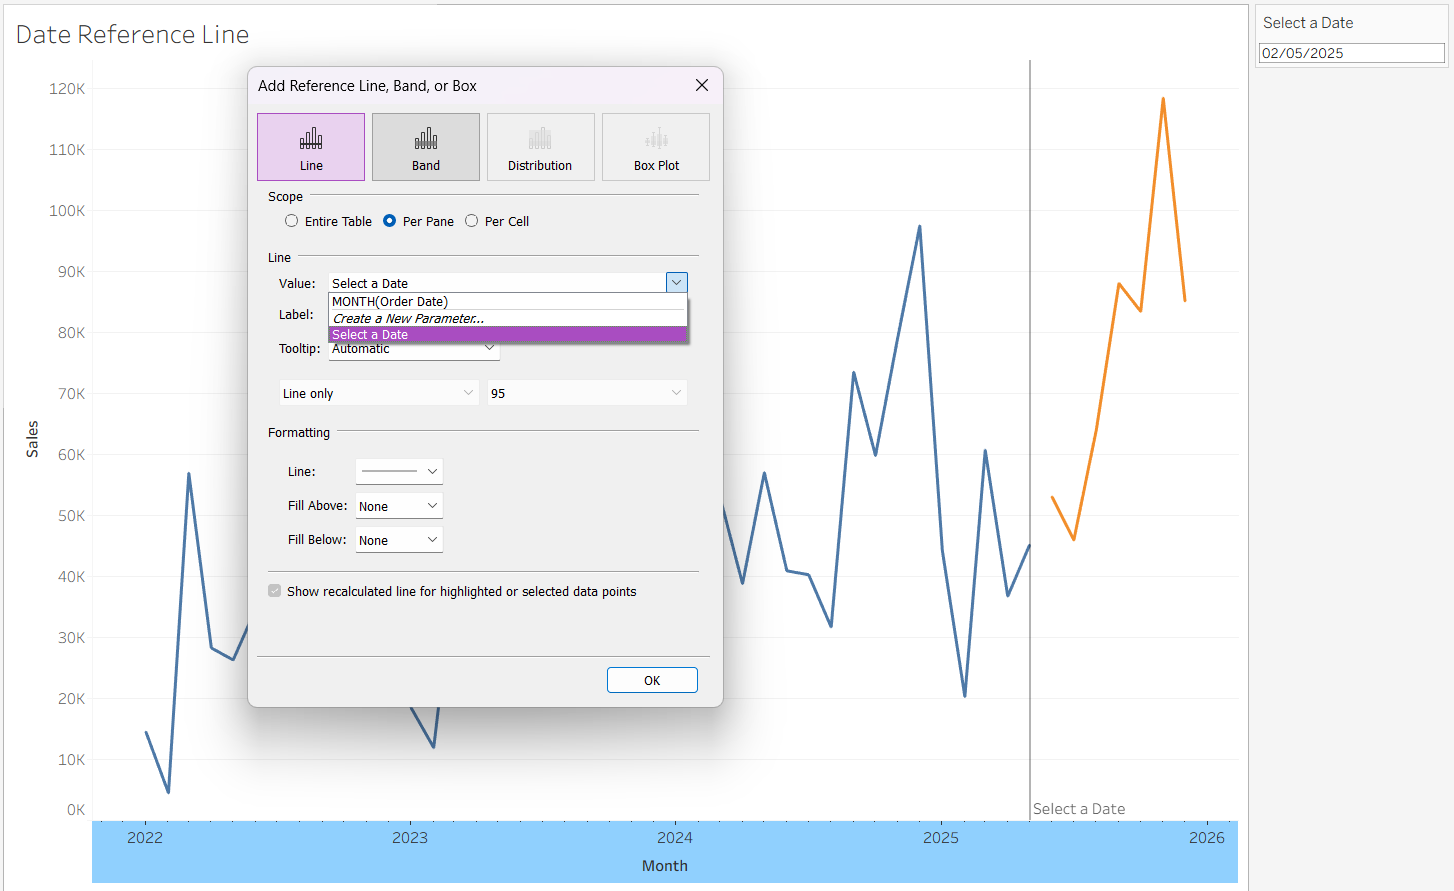
Afterwards we can add the reference line just like we did before!
Although parameters and filters can appear similar, they behave quite differently. Filters always remove data from the view, whereas parameters may remove data or simply change how it is displayed. Filters can also allow multiple selections and are tied directly to a specific field and dataset, while parameters are single-select and independent of any field. Lastly, filters cannot be used inside calculations and may slow down performance.