


In week two, whilst we were having fun learning how to use Tableau and Tableau Prep, we also learnt lots about the importance of planning. What's going to be the best approach when it comes to our first client project? We should probably start with a plan.
The two things I might want to remind myself about later is exploratory vs explanatory and sketches.
Exploratory vs Explanatory. How do we communicate with data? What's the difference?
Exploratory - displays the data clearly and provides tools to help users interact with the data. It doesn't provide any analysis of the findings but is a good tool for either a client who has varying needs or is looking for a broad overview.
Explanatory - takes the data and translates/shapes key findings into a story for the user. Generally you will present key points of interest from the data and it's great for clients who need answers to specific questions.
Exploratory
These dashboards will allow the user to discover insights on their own. Providing lots of interactive tools like filters, drill-downs, or tooltips for them to explore all the data at different levels of granularity.
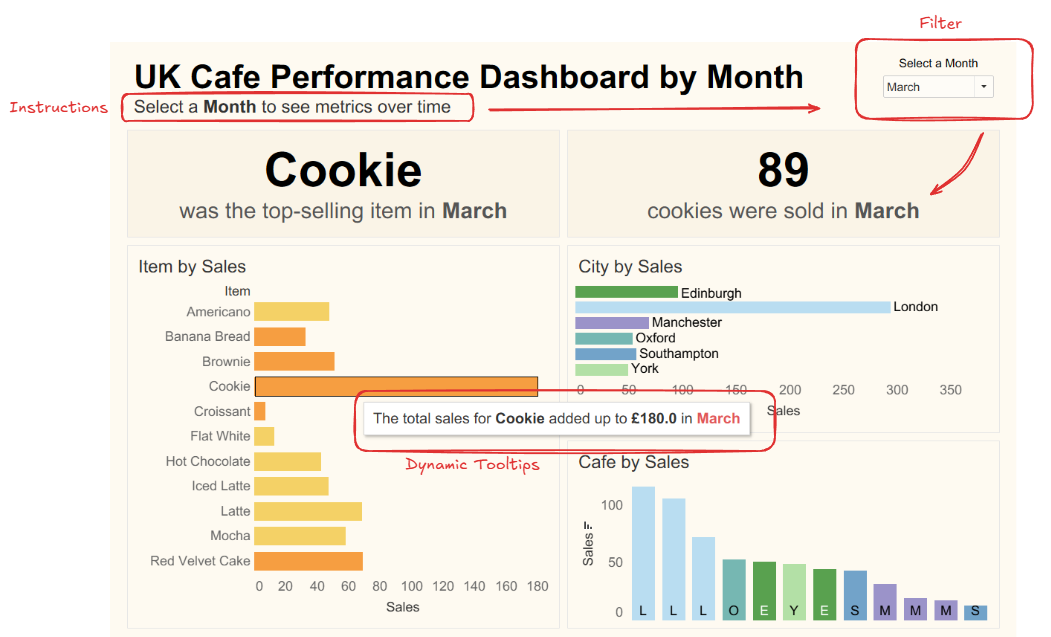
With exploratory dashboards you need to understand who the consumers are and what type of questions they might want the answers to. They might just want to explore the data in-depth or there might be multiple types of users with different levels of expertise and experience with data. No matter what, the interactivity will help them investigate certain insights or trends themselves. Any users who may want quick and clear answers or who may be less comfortable with using Tableau might want more of a guide though.
Explanatory
An explanatory dashboard will guide the user through a more focused narrative. By analysing the data and providing the key findings, you can answer a specific question that a client has. To do this you might use statement titles that answer questions clearly or lead the user in a certain direction, you can use annotations, and you can use colours strategically. The important thing is to keep everything clear and related in order to guide them through the narrative.
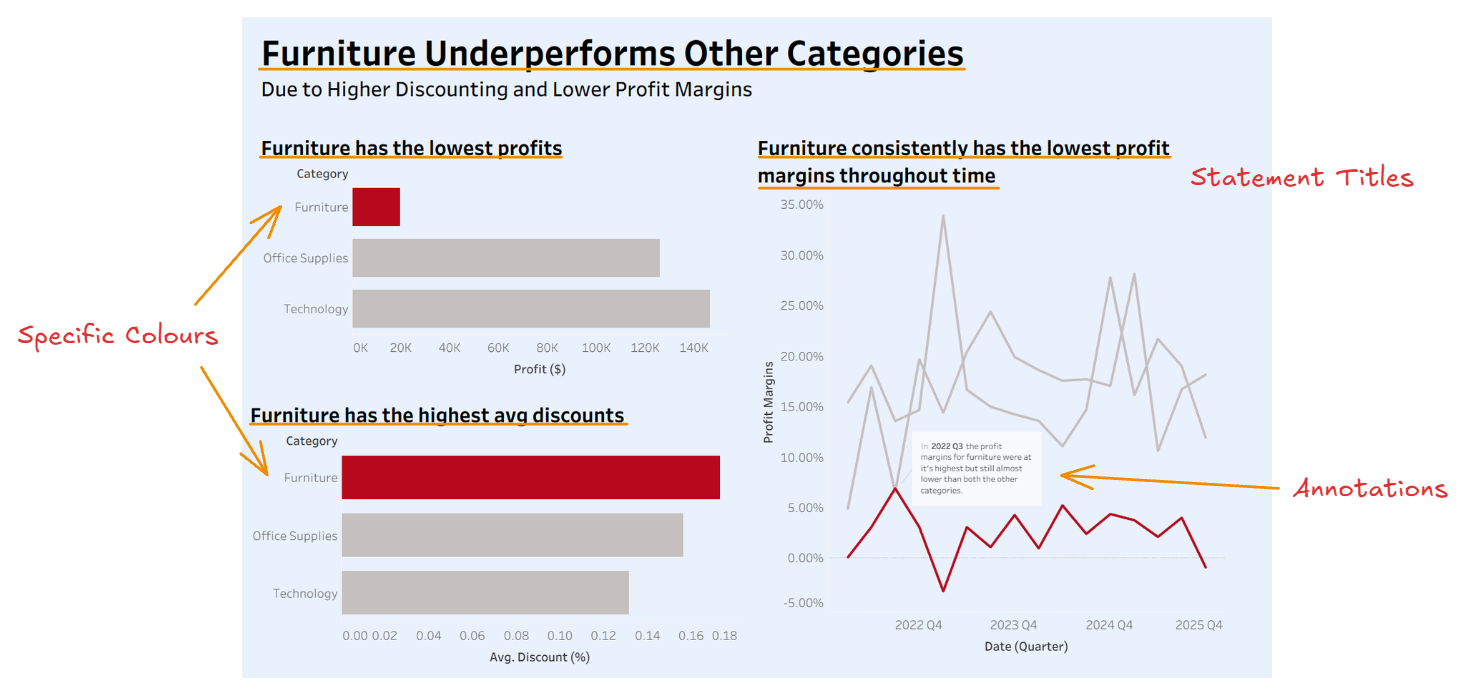
With these you might know exactly what insights the user is after, your client might need a clear answer to a question, or you may need to guide the user through a specific narrative step-by-step. You most likely wouldn't use it if there were many different types of users or if you weren't familiar with all of the user needs.
Sketches
Before any building begins, sketches help align expectations, reduce confusion, and ensure that both the client and the product builder understand what’s being created. There are three types of sketches: Concept, Design, and Technical.
Concept Sketches
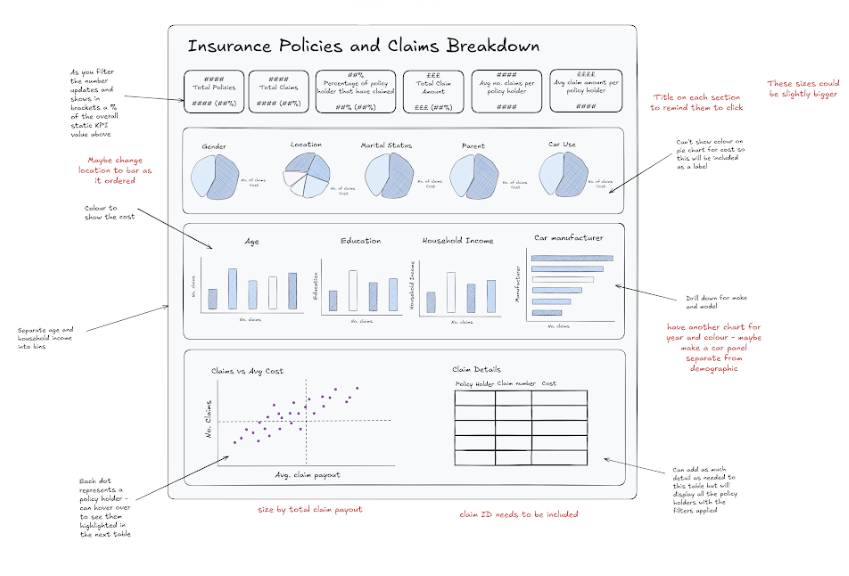
Concept sketches are usually the first step in the process. They are aimed at both the client and the product builder and focus on what the product will do rather than how it will be built.
The purpose of a concept sketch is to understand the content that will be covered and to communicate the experience a user will have when interacting with the product.
They should include general details about charts, such as titles, key KPIs, and expected interactivity. For KPIs in particular, it’s important to clearly define:
- What metrics will be included
- Units and significant figures
- Time period covered
- Whether change over time or percent of total will be show
Design Sketches
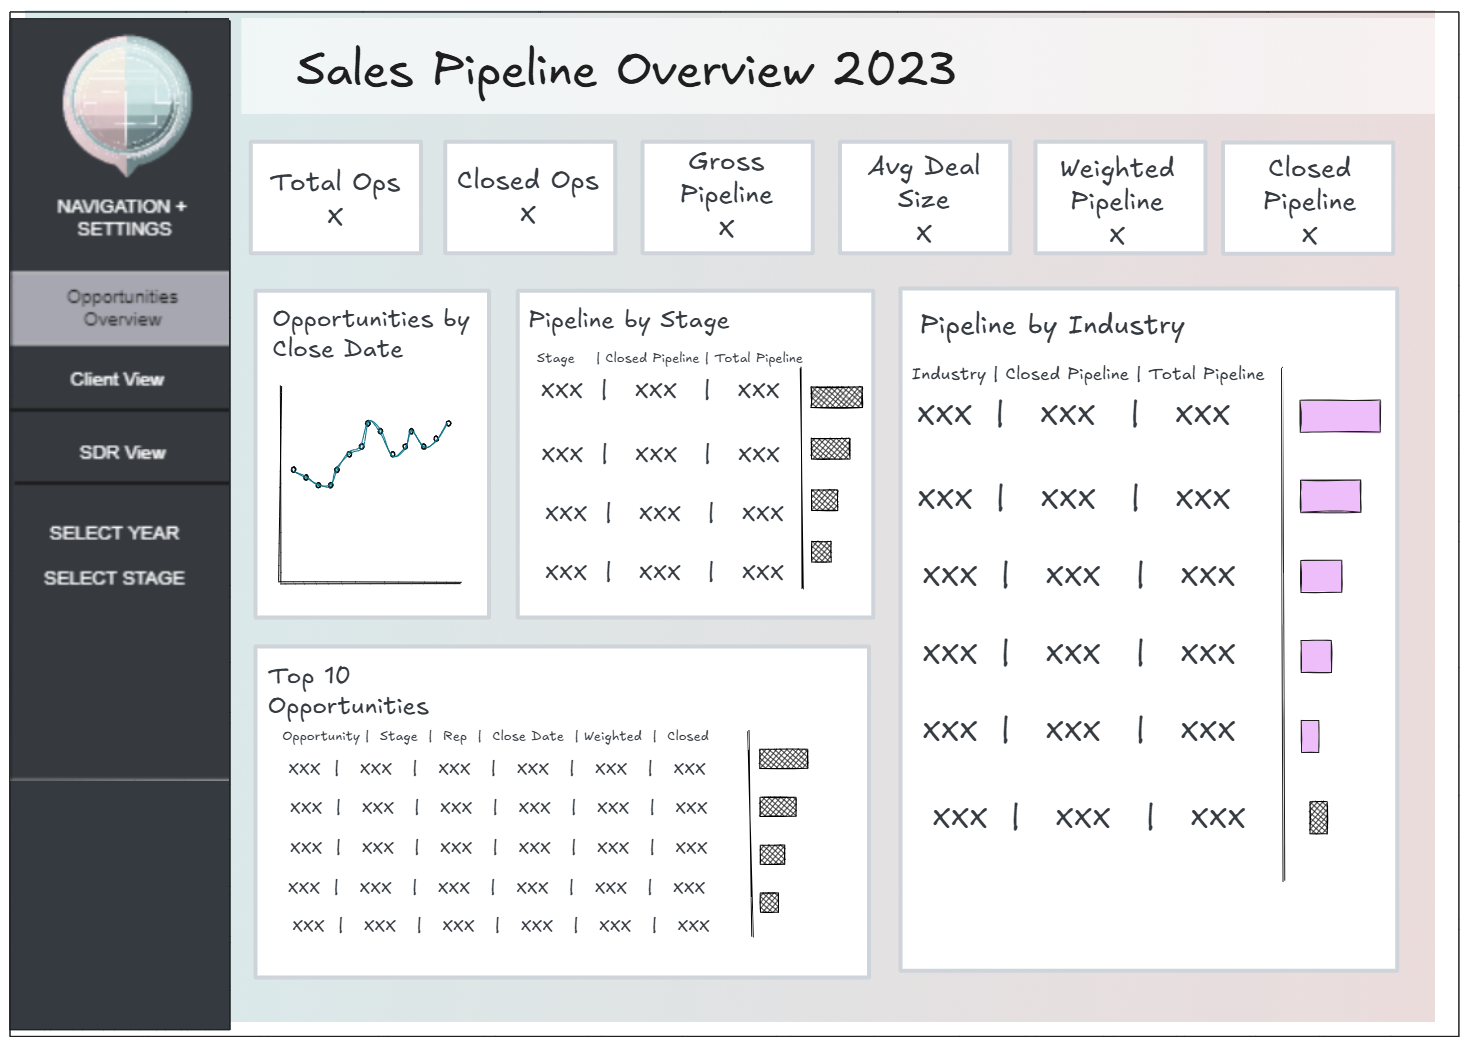
Design sketches build directly on the concept sketch and move closer to what the final product will look like. These are intended for clients, stakeholders, and product builders, and they act as a more detailed guide to the dashboard ahead of development.
A design sketch demonstrates how the dashboard will answer key business questions and gives details on:
- Layout and structure
- Colours and branding
- Interactivity and filters
One of the main purposes of the design sketch is to create an opportunity for the client to sign-off, which helps reduce scope creep especially for longer projects.
Technical Sketches
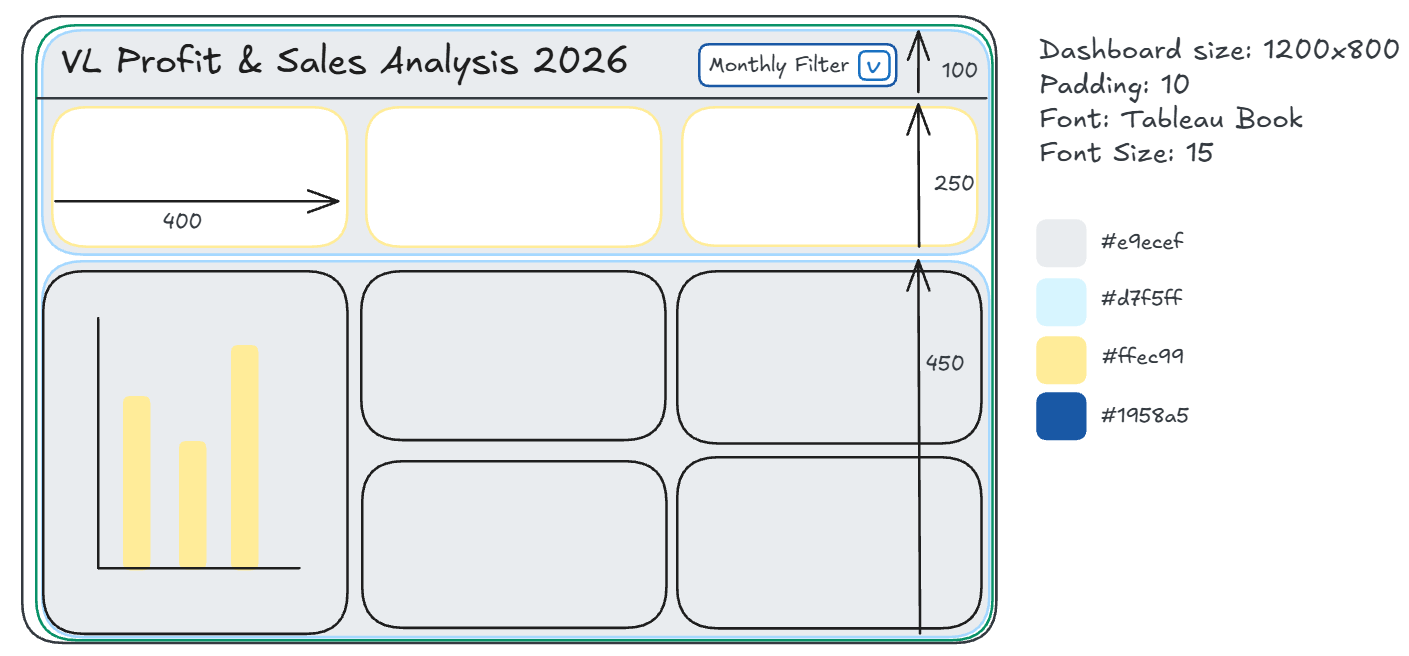
Technical sketches are created primarily for the product builders and act almost like a guide or dashboard template. Unlike the other sketches, this one focuses entirely on how the product will be built.
The technical sketch ensures consistency across a suite of products and provides all the information needed to meet expectations and break the build into manageable tasks. It answers questions such as:
- What are the dimensions?
- What padding, line weights, and font sizes should be used?
- What colour palettes and hex codes apply?
This sketch should include clear instructions for all integral elements of the product, including:
- Colour palettes and branding assets
- Container layouts (including hidden containers and info buttons)
- Filters, sets, parameters, legends, and free text boxes
- Parameter and calculation standards (especially when combining workbooks)
While the technical sketch may give visual cues, its main role is to record decisions that could otherwise be interpreted differently by different people. If it's your project management week, you'll most likely be working on the technical sketch.