


In week 3 day 1 we did a little intro into table calcs. We're going to have more sessions on Spatial calculations but this is everything I think I understand about them so far.
Spatial calcs work with geographic data e.g. points, lines, and polygons using Geometry. To make it easier I'm going to use the same London pub data in all these examples.
1 - MAKEPOINT
Creates a point using the x-coordinate and y-coordinate so it might look like:
MAKEPOINT([Latitude], [Longitude])
or MAKEPOINT(51.5033, -0.1195) which is the coordinates for the London Eye.
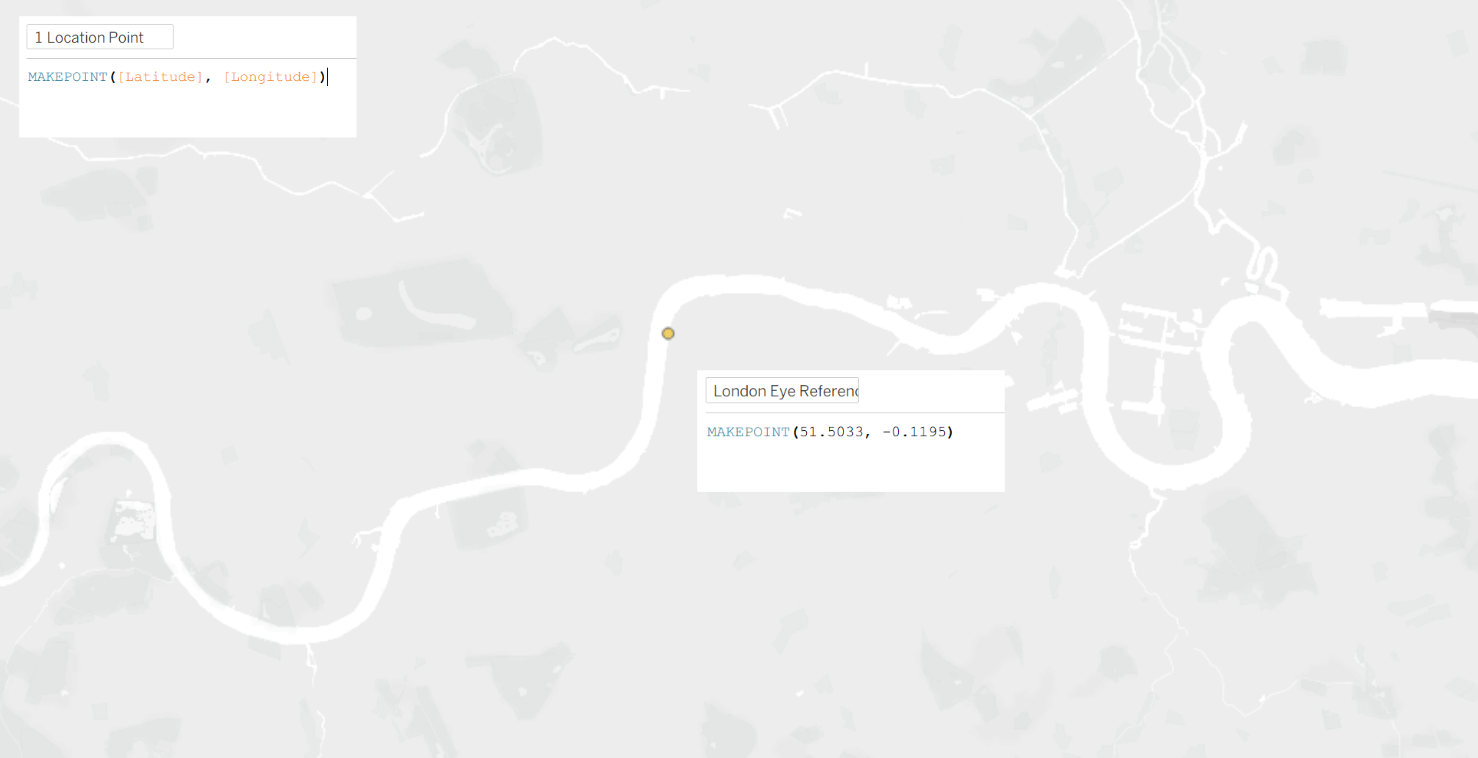
MAKEPOINT essentially turns numbers into a real location on a map. This is useful for creating a specific reference point or plotting coordinates on the map. It's also used in further calculations like distance and buffers.
2 - DISTANCE
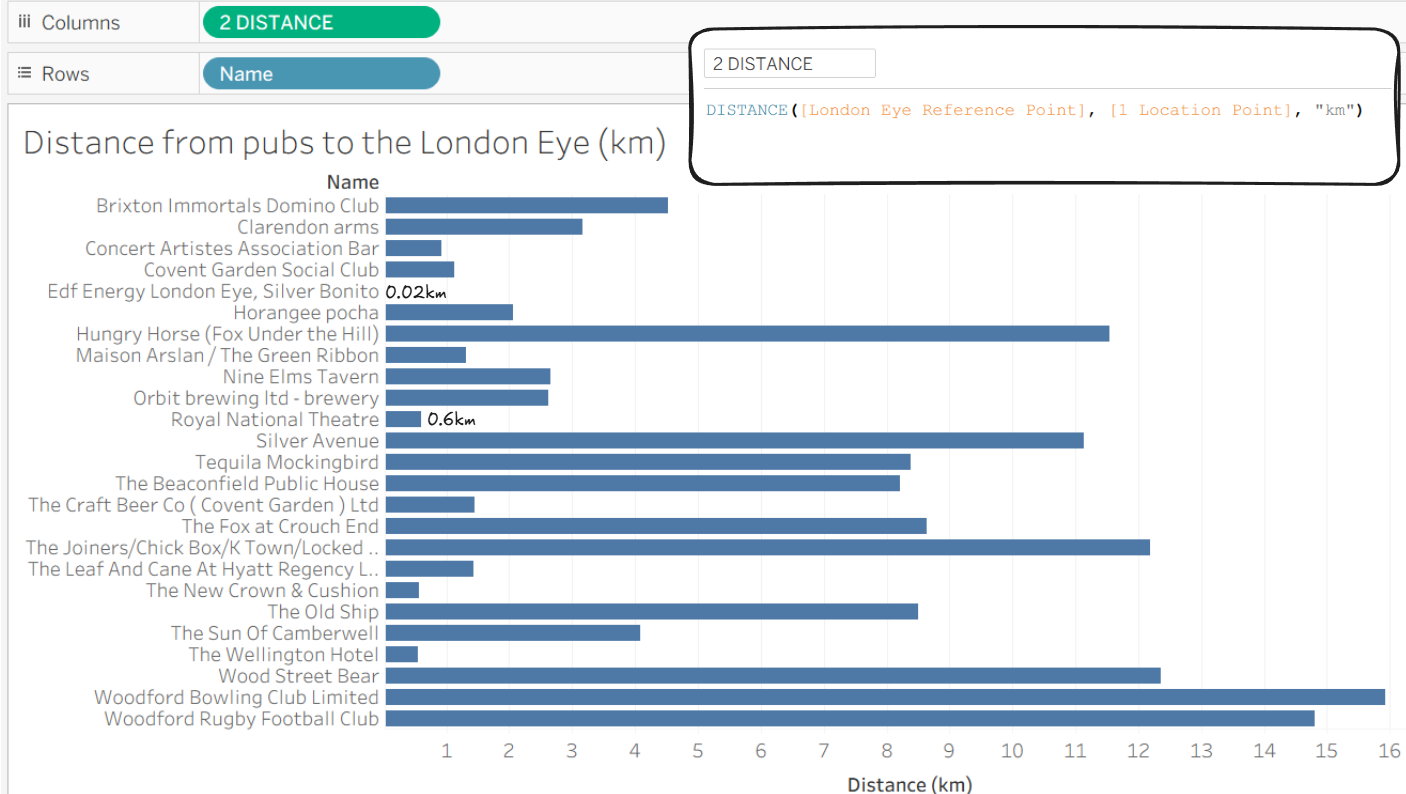
Distance measures how far two points are from each other in a straight line.
DISTANCE(start, end, units)
The units could be:
- metres or m
- kilometres or km
- miles or mi
- feet or ft
DISTANCE([London Eye Reference Point], [1 Location Point], "km") would return the distance in kilometres from the London Eye to the set Reference Point which in this case is the location of each pub. So we can see some pubs which are over 10km away from the London Eye and some which are under 0.5km.
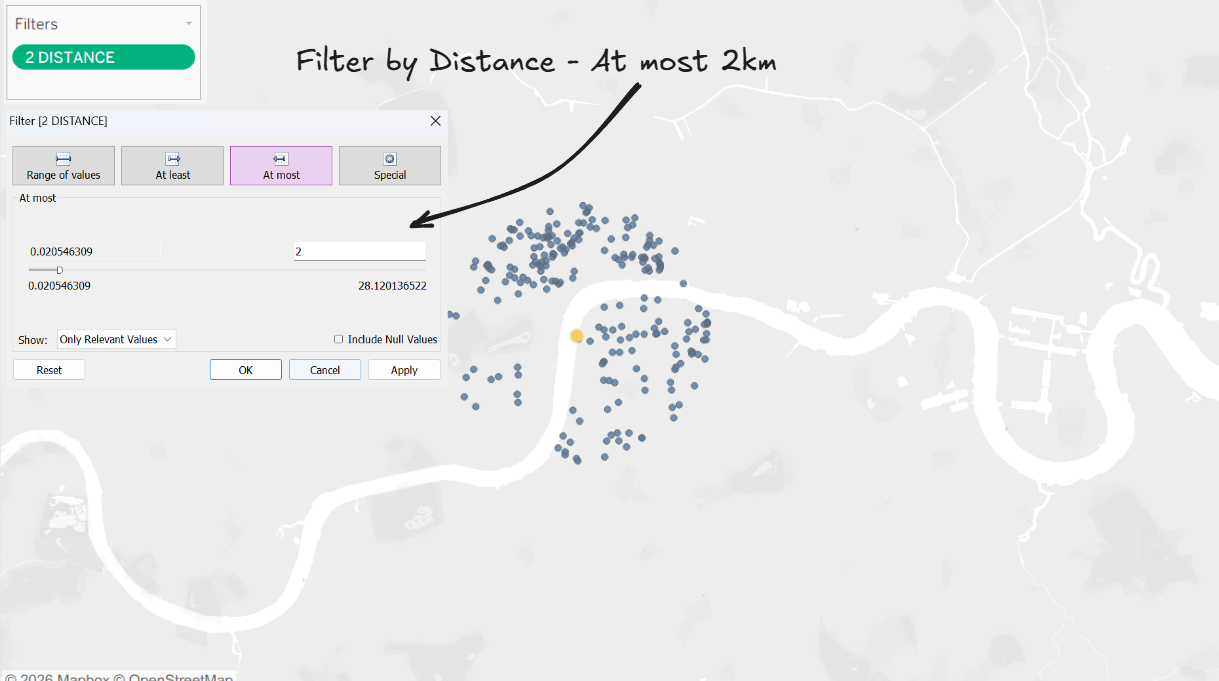
You could also use DISTANCE on a filter. The example below shows what a 2km filter would look like on the map - returning all the pubs in London that are a distance of 2km away from the London Eye.
3 - BUFFER
Creates a radius around a geometry
BUFFER(geometry, number, units) e.g. BUFFER([Location], 1, "mi")
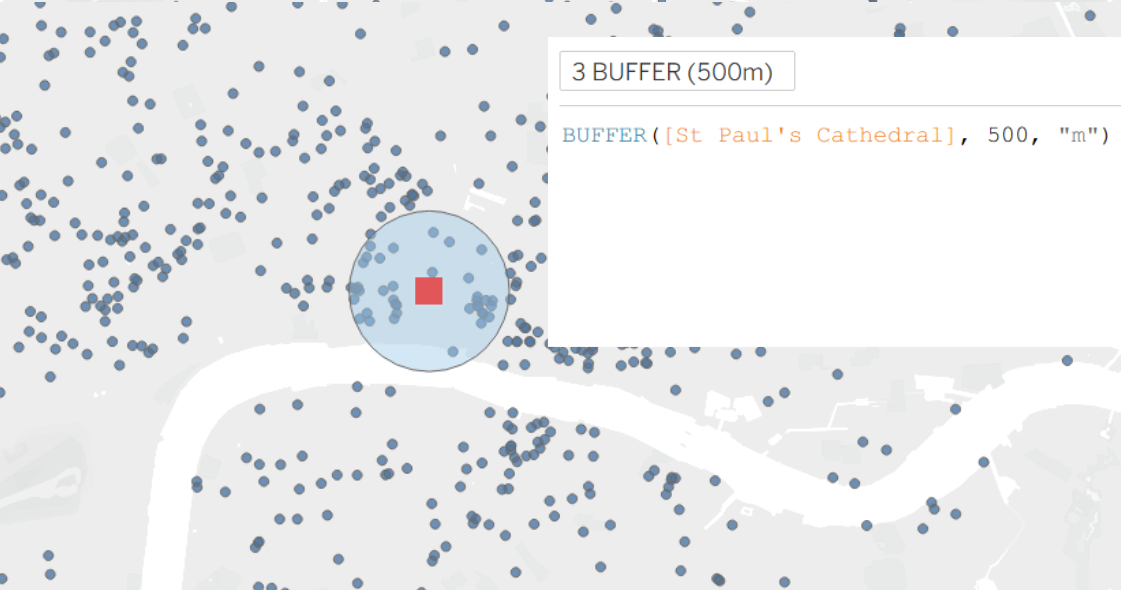
BUFFER([St Paul's Cathedral], 500, "m") this calculation highlights all the pubs in a 500 metre radius from St Paul's Cathedral which might be useful to anyone in the office :)
This would give similar results if you used a distance calc on filter like before but the BUFFER let's us see all the other pub points outside of the BUFFER too.
4 - OUTLINE
Outlines a radius around a geometry. For example OUTLINE([Spatial])
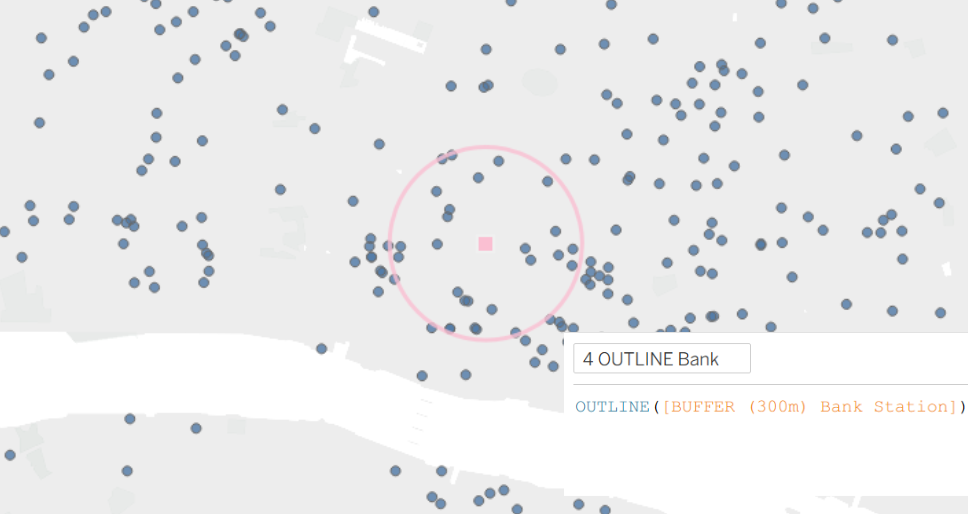
This example is actually outlining a 300 metre buffer around Bank Station. But OUTLINE can be used to outline polygons as well e.g. for outlining London Boroughs or London congestion zones.
This example of an OUTLINE looks very similar to a BUFFER but as it's not coloured in, it does make it easier to see what's inside.
5 - INTERSECTS
INTERSECTS checks if two geometries overlap and returns a Boolean (True/False). For example INTERSECTS(geometry1 geometry 2)
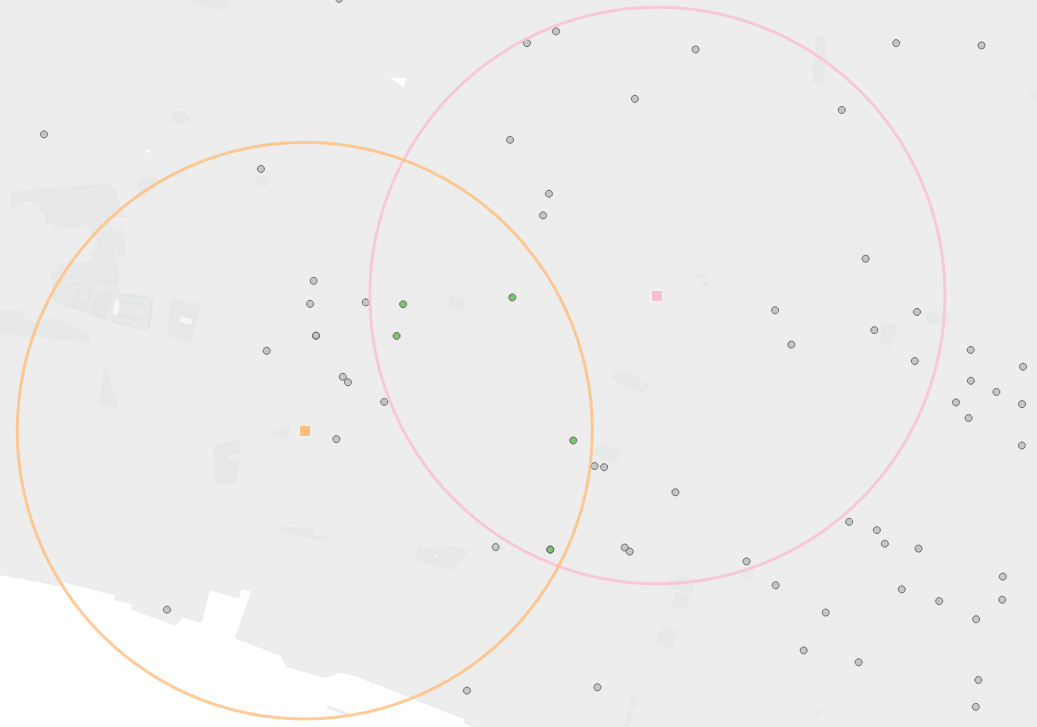
So for this last example pink represent Bank Station and it's 300 metre OUTLINE and orange is for Mansion House Station - two stations that are conveniently close to the office.
The calculation is:
INTERSECTS([Pub Location Points], [Bank Station Outline])
AND INTERSECTS([Pub Location Points], [Mansion House Station Outline])
What this is doing is returning true for the pub points that are inside both Bank and Mansion House's OUTLINE and you can also put this on colour so in this case green is 'True' and grey is 'false'.