


When analysing business performance, it’s easy to default to the same two metrics: sales and profit margins. They’re familiar, easy to track and provide a quick indication of how things are going.
But on their own, they can create a misleading picture. Some of the most important insights a business needs are often hidden in data that doesn’t always make it into the conversation.
Operational costs and the burden they place on profit are a good example of this. Looking at what it actually costs to run each part of a business and what proportion of profit those costs consume can completely change how performance is interpreted. A store, team or business unit that appears healthy on the surface can look very different once that layer is added.
To explore this idea, I created a dashboard, ‘Beyond the Headline Metrics: Store Viability’, using a fictional retail dataset. While the numbers are not real, the insight they demonstrate is. At an overall business level, the headline metrics appear healthy. But once performance is broken down by store, you start to see that some locations may be creating operational pressure that could limit long-term growth.
Dashboard overview
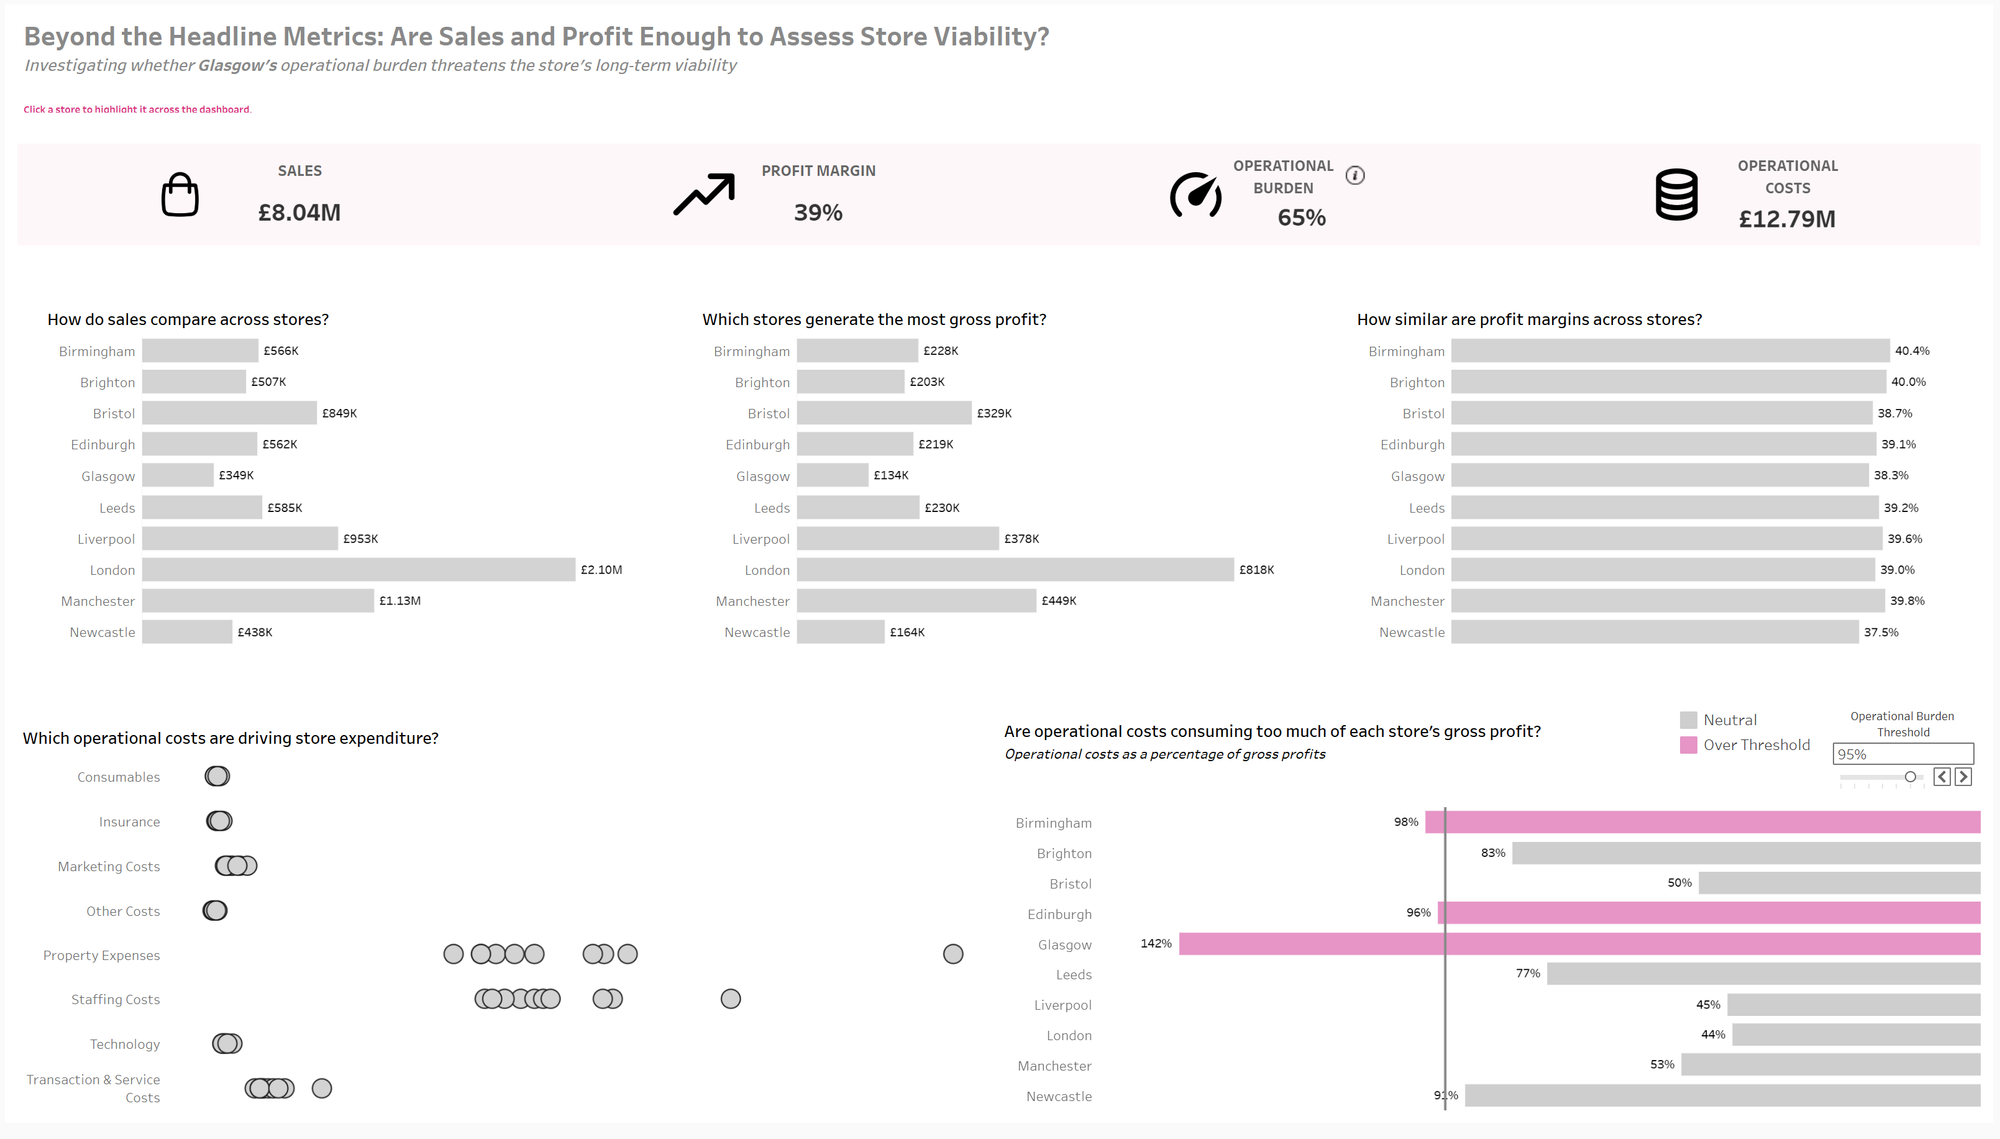
The dashboard combines sales, gross profit, operational cost breakdowns, and operational burden on profit breakdowns to provide a more complete view of store performance.
What is the operational burden on profit?
Operational burden on profit measures the percentage of a store’s gross profit consumed by operating costs.
In simple terms:
Operational Burden on Profit = Operational Costs ÷ Gross Profit
This metric answers a different question from profit margin.
- Profit margin shows the proportion of sales retained as gross profit.
- Operational burden shows how much of that gross profit is absorbed by the cost of running the store.
A value above 100% means operational costs exceed the profit being generated. In practice, this means the store cannot fully cover its operating costs from its own gross profit, so the shortfall would need to be funded elsewhere within the business.
The value of this metric is that it shifts the analysis from performance alone towards sustainability.
A store that looks healthy on paper
Glasgow provides a clear example.
At first glance, the store does not appear particularly concerning. It has the lowest sales and gross profit across the business, but the profit margin remains broadly in line with the other stores. Based on those metrics alone, Glasgow could easily be seen as a smaller store that is still performing efficiently, rather than one facing an obvious sustainability issue.
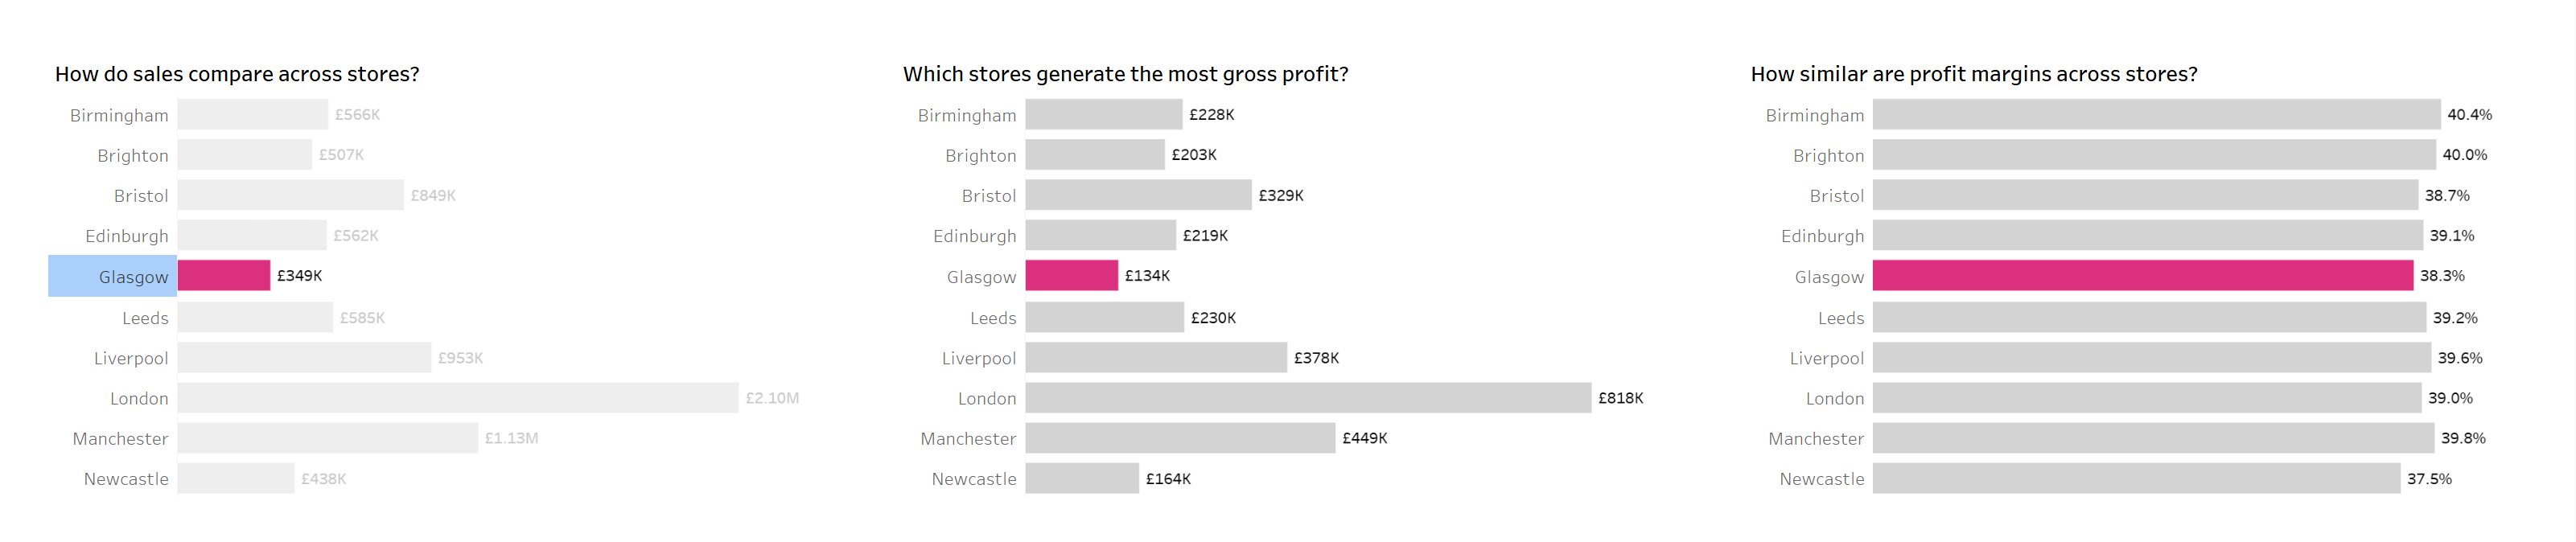
The picture changes when operational burden is introduced.
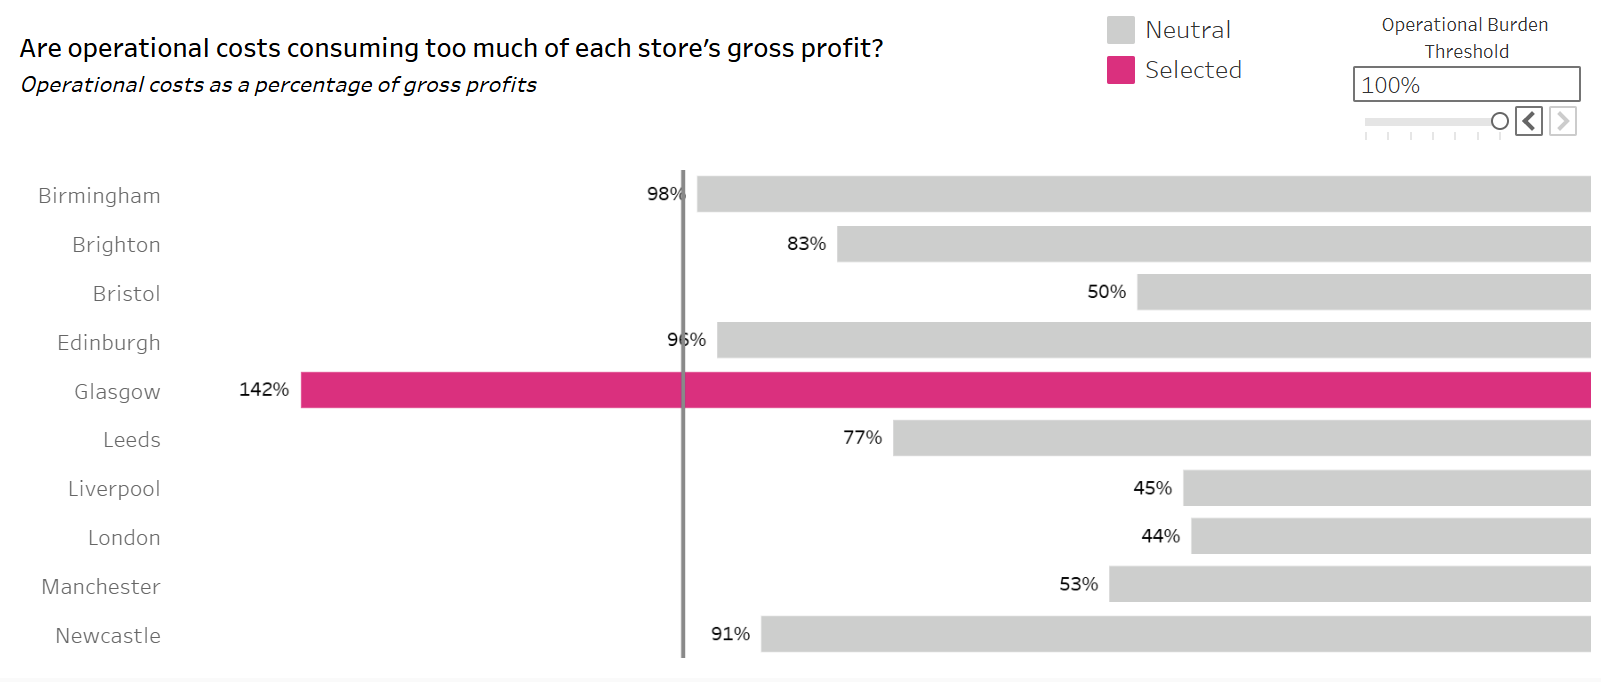
Glasgow’s operational burden sits at 142%.
This means its operating costs are equivalent to 142% of the gross profit it generates. In other words, the store cannot fully cover its operating costs from its own gross profit. The resulting shortfall would therefore need to be funded elsewhere within the business. This may be manageable in the short term. However, it raises questions about the store's long-term sustainability.
Nothing in the headline performance metrics immediately highlighted this risk. It became visible only when profitability and operational costs were viewed together.
Beyond the 100% threshold
The metric is still valuable even when stores are below 100%. A store does not need to reach the point of unsustainability before it becomes worth paying attention to.
Lowering the operational burden threshold to 80% highlights that five of ten stores already have a large proportion of gross profit absorbed by operating costs. These stores can still cover their operating costs, but they have less headroom for change.
Brighton is a good example. It sits at 83%, meaning it is not currently in an unsustainable position. However, changes in operating costs or gross profit could put greater pressure on the store over time.
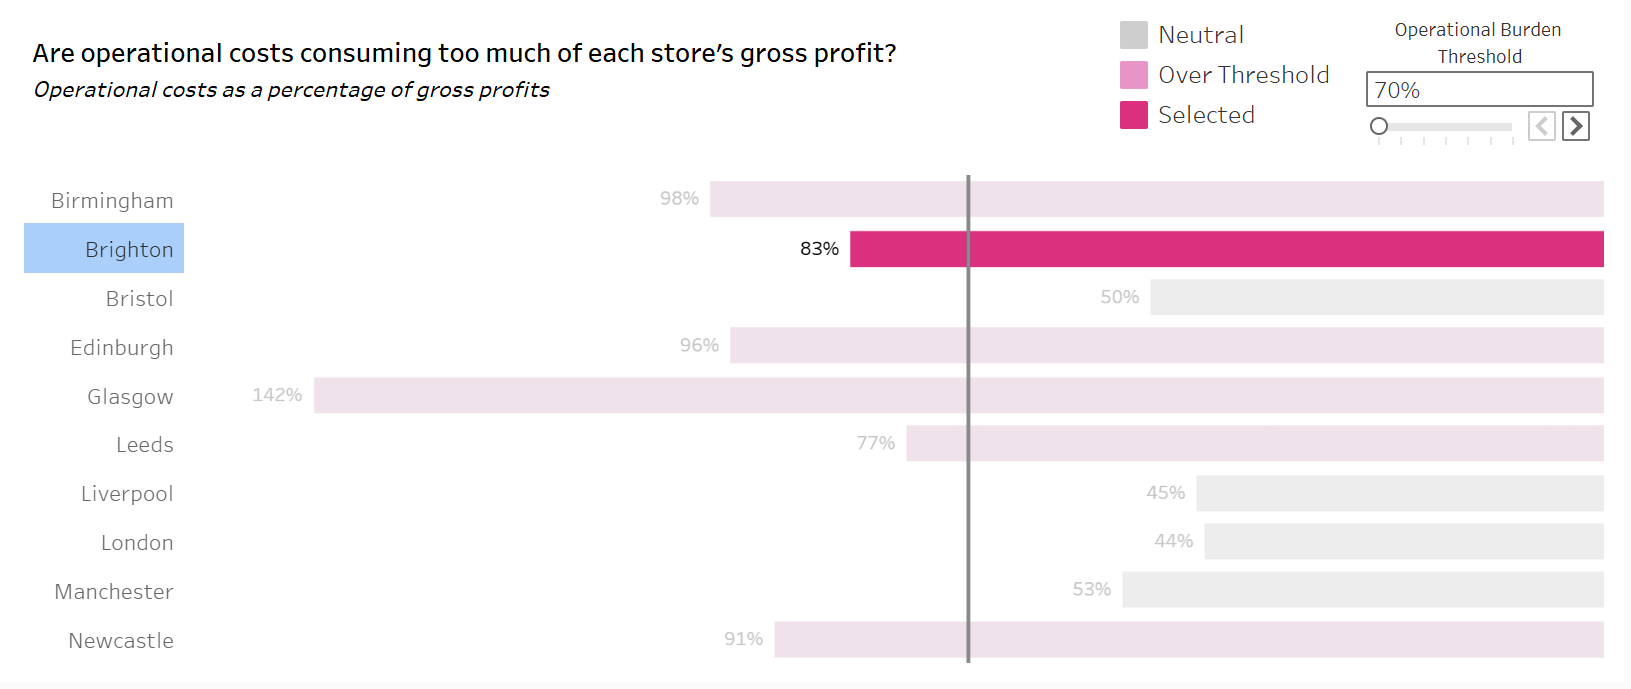
The value here is in looking ahead. Identifying this pressure early gives the business an opportunity to understand what is driving costs and whether there are areas that could be managed differently before the issue becomes more significant.
What is driving the operational pressure?
Identifying that Glasgow has a high operational burden is only the first step. The next question is what is actually driving those costs.
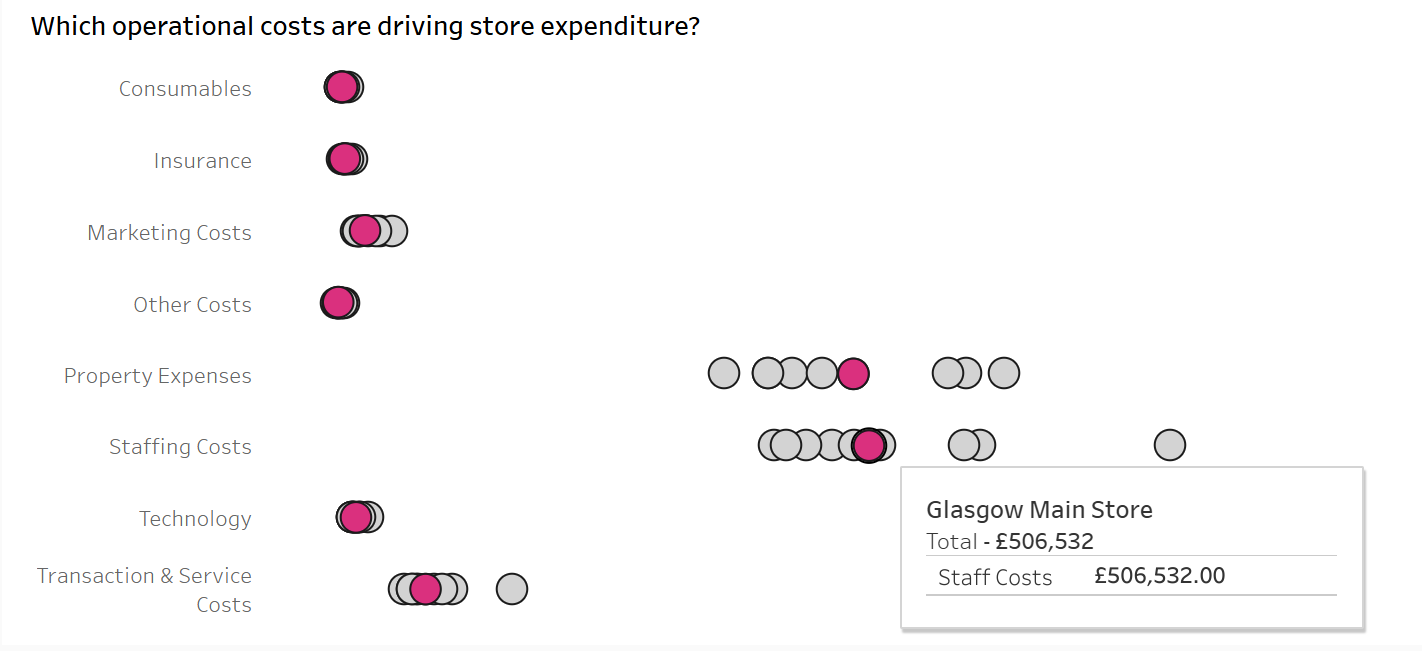
Looking at Glasgow’s operational expenditure in more detail shows that the pressure is not coming from a single area. Staffing costs are the largest grouped expense at around £507k, followed closely by property expenses at approximately £492k.
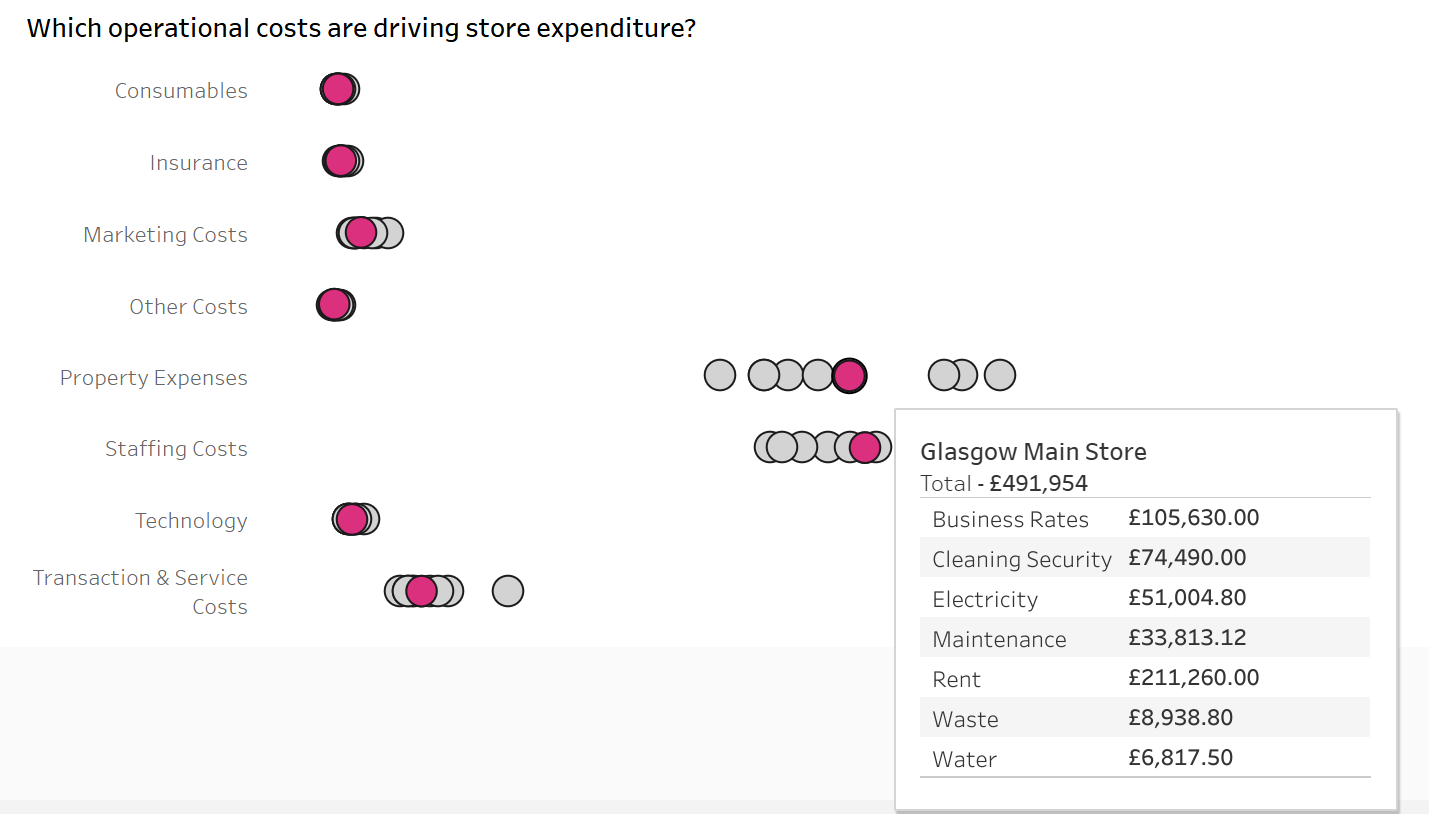
Drilling further into property costs shows that rent makes up the largest share at £211k, followed by business rates at £106k and cleaning and security at around £74k.
This is where the analysis becomes more useful for decision-making. Rather than simply knowing that Glasgow’s costs are too high relative to the gross profit it generates, the business can start to see where that pressure is coming from and which areas may be worth investigating further. The purpose is not to assume that a particular cost should automatically be cut, but to provide a clearer starting point for conversations about efficiency, operating models, and whether the current cost structure makes sense in the long term.
Why this changes how performance is interpreted
Profit margin is useful, but on its own, it only tells part of the story.
Glasgow shows that a store can have a profit margin broadly in line with the others while still facing operational costs that put pressure on its long-term viability. Looking at both measures together provides a more complete view of store performance and helps show whether the profit generated is sufficient to support the way the store currently operates.
What decisions does this support?
Once the operational burden becomes visible, the analysis moves closer to decision-making by showing where further investigation may be needed.
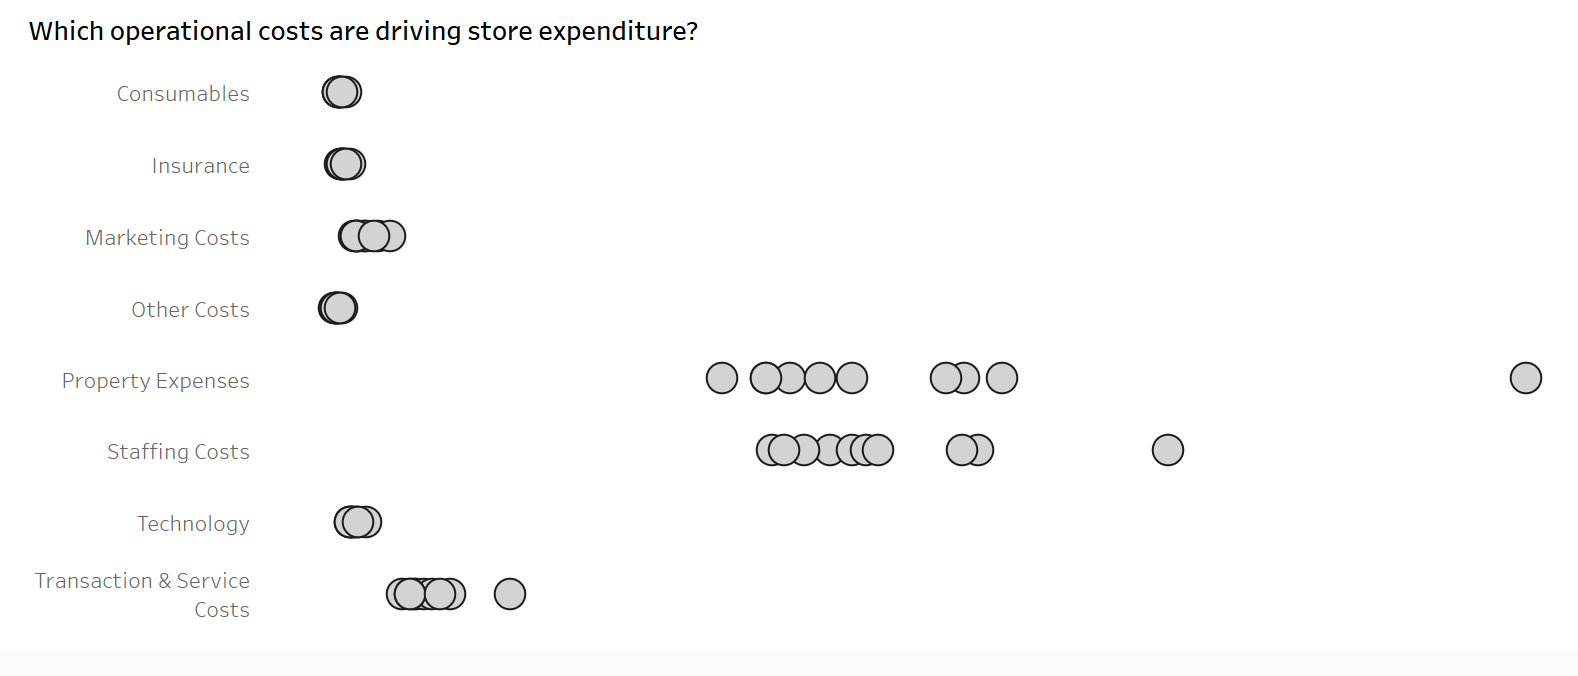
Across the business, property expenses are the largest operational cost at around £5.5m, followed closely by staffing costs at approximately £5.2m. This suggests that operational pressure is not being driven by one single area and that different stores may require different types of investigation.
For a store like Glasgow, where operational burden already exceeds 100%, this could prompt a more immediate review of its cost structure, including staffing and property-related expenses. For stores such as Brighton, which remain below 100% but have less headroom, the focus may be more on monitoring costs and identifying changes before they become a larger issue.
There is no single automatic response to a high operational burden, but it can make it clear when action is needed. In Glasgow’s case, a 142% burden would justify an immediate review of how the store operates. That could mean reducing costs, changing the operating model, closing the store, or exploring lower-overhead alternatives, such as expanding online sales to reach customers without carrying the same physical-store costs. The important thing is that the analysis shows where the pressure is coming from and gives the business a clearer basis for deciding what to do next.
Looking at the bigger picture
Looking beyond individual stores also changes how the overall business is viewed.
Healthy headline figures at the business level can hide pressure within specific locations. A business may appear to be performing well overall, while some stores are consuming a much larger share of the profit they generate, leaving less room to absorb changes or support future growth.
That shifts the question from:
‘How well are we performing?’ to ‘How sustainable is this performance?’
Operational burden does not replace the metrics businesses already use. It adds another layer that can help identify where apparently healthy overall performance may be masking issues underneath.
Closing Perspective
Profit and sales will always be important starting points, but healthy headline numbers do not necessarily mean every part of the business is performing sustainably.
Looking a little deeper can show where operational costs are taking up too much of the profit generated, where stores have less room for change, and where pressure could become a bigger issue over time.
For me, that is the real value of looking beyond the headline metrics. It is not about finding another number to report on, but understanding what is happening underneath the performance you can already see.
Sustainability lives in the details behind the numbers, and those details are worth looking for.
Explore the full dashboard
You can interact with the dashboard below, select individual stores and adjust the operational burden threshold.