


Scaffolding is one of those data prep terms that sounds more complicated than it is. At its simplest, it means creating the rows your analysis needs but your dataset doesn’t currently have.
In Tableau Prep, we can do this using the New Rows step. This allows us to fill gaps in sequential data, such as missing dates, or to create rows between a start date and an end date.
Why would we need scaffolding?
Sometimes the information we need is present in our data, but the way the data is structured gets in the way of analysing it easily.
For example, if we have daily order data, we might only have rows for the days where orders were placed. That may be fine in the raw data, but it can cause problems when we want to analyse trends over time. A bar chart showing orders by day might not leave any visible gaps, making it harder to spot that there were days with no orders at all.
Another common example is data with a start date and an end date, such as a promotion period, project timeline, or subscription plan. We might want to analyse how many subscriptions were active on each day, or how many projects were running at once. However, if each record only has one row with a start and end date, that analysis becomes harder.
Scaffolding helps us create a more complete structure for analysis. We can add missing rows, such as days without orders, or create one row per year, month, week, or day between two dates, such as the active period of a subscription.
Option 1: Filling missing dates from one field
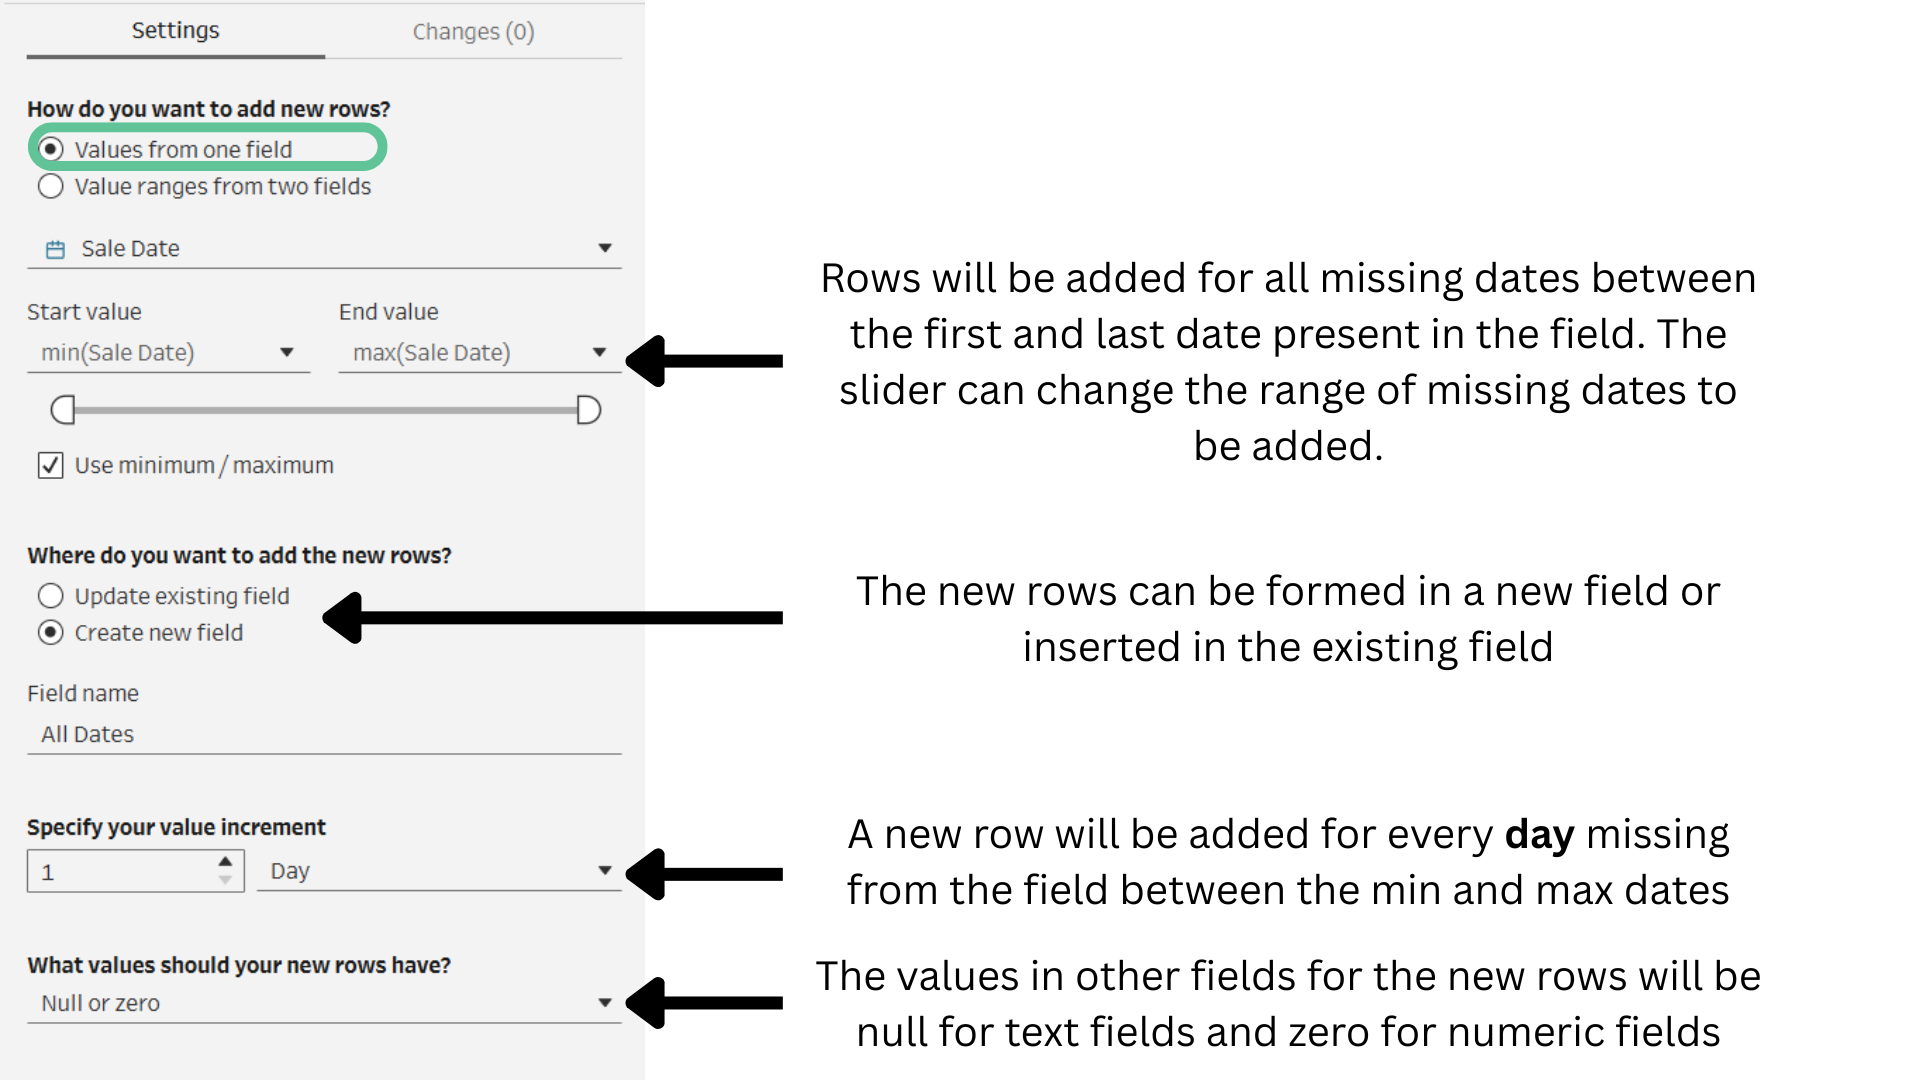
One way to use New Rows is to generate missing values from a single field.
For example, imagine we have this data:
| Date | Orders |
|---|---|
| 1 Jan | 12 |
| 2 Jan | 9 |
| 5 Jan | 15 |
In this case, 3 Jan and 4 Jan are missing.
Using New Rows, we can tell Tableau Prep to look at the Date field and generate the missing dates between the minimum and maximum values.
The result would look like this:
| Date | Orders |
|---|---|
| 1 Jan | 12 |
| 2 Jan | 9 |
| 3 Jan | 0 / Null |
| 4 Jan | 0 / Null |
| 5 Jan | 15 |
We can then choose whether the values in the other fields should be filled with Nulls or zeros, (numeric fields will be filled with zeroes, while text fields would be filled with Null) or copied from the previous row, depending on what we need.
Option 2: Creating rows between a start and end date
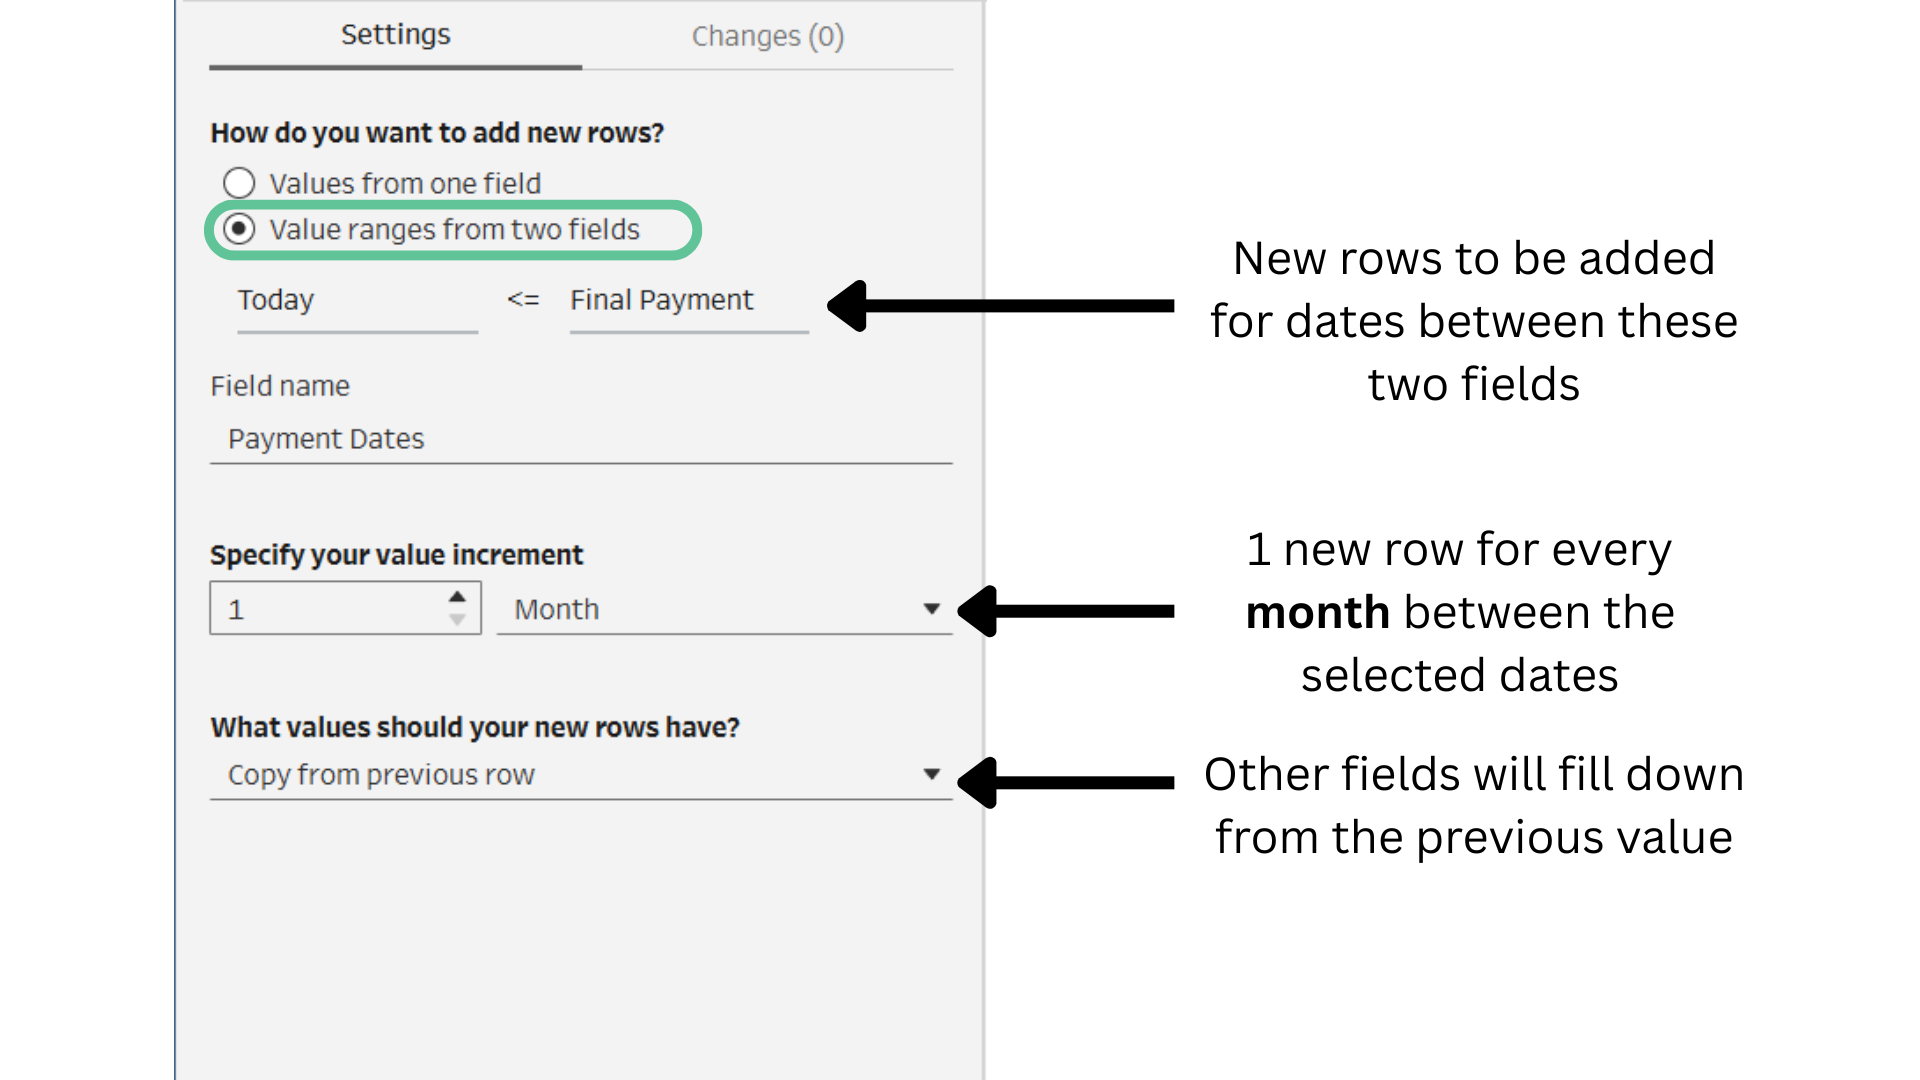
The second version uses two fields: a start date and an end date.
For example:
| Campaign | Start Date | End Date |
|---|---|---|
| Spring Sale | 1 Mar | 3 Mar |
This tells us when the campaign was active, but if we want to analyse campaign activity by day, we need one row for each date.
Using New Rows with a range between two fields, Tableau Prep can create:
| Campaign | Date |
|---|---|
| Spring Sale | 1 Mar |
| Spring Sale | 2 Mar |
| Spring Sale | 3 Mar |
This can be done by day, week, or month depending on the level of detail needed.
It is also worth noting that if you have a start date and a duration, in months for example, you can first create an end date using a DATEADD() calculation, and then use that calculated end date for your scaffold. Just be careful to check exactly what the end date represents. For example, if a subscription ends on 2 March, the final month you want to include may actually be February, depending on how the subscription is billed.
Why do this in Tableau Prep rather than Tableau Desktop?
You can handle some missing date problems in Tableau Desktop using options like Show Missing Values, or by joining to a separate scaffold table. However, those methods are usually more tied to a specific view or workbook.
The advantage of doing this in Tableau Prep is that the scaffolded rows become part of the prepared dataset. The logic is visible in the flow, can be reused, and can make the final Tableau workbook simpler.
That said, scaffolding can also make your dataset much larger. If every row is expanded into daily records across a long time period, the number of rows can grow very quickly. So it is always worth checking whether you really need the extra rows, and at what level of detail.
Other use cases
Scaffolding can be useful for:
- filling missing dates in sales or order data
- creating daily rows for active campaigns
- expanding booking start and end dates
- analysing open tickets over time
- tracking employee headcount by month
- looking at subscriptions or contracts across their active period
Final thoughts
The New Rows step in Tableau Prep is a really useful way to fill gaps in sequential data. Whether you are adding missing dates or expanding a start and end date into a full set of rows, scaffolding helps create a dataset that is easier to analyse. As always, the main thing is to check the row count before and after the step, so you know exactly what Prep has created.