Our final week of training - Dashboard Week - begins today. Each day, we'll be presented with a different challenge and will have to make a dashboard and write a blog (and possibly do some web scraping and data prep) by 3:30, at which time we'll present what we've done.
Data Prep
Today we were presented with data from the U.S. Department of Education (link to download). The first bad sign was when it took several minutes just to download the data and things only got slower from there. There were a lot of different files (representing different time periods) but I decided to explore just one of the files, dealing with data relating to different universities. I'd like to give you a more complete picture of what that data contained but as there were over 3,000 fields, that would take a long time (as did trying to work with the data in Alteryx). Even after I had run a workflow, it took several minutes from when I clicked on a browse tool to when the results window opened. This was the first big challenge. Reading through the data dictionary that I found online and then trying to select only the relevant fields to bring into a hyper file that I could use in Tableau took several hours.
The good news is that the actual cleaning was pretty simple. There were strings that indicated missing values rather than actual nulls so I replaced those with nulls using a Multi-Field Formula tool. Then I used the Auto Field tool to convert each field to the smallest possible appropriate data type in order to be able to work with a smaller file. Finally, I replaced integer values for a number of fields with the corresponding string values according to a lookup table provided in the data dictionary (for example: a value of 1 for the Region field indicated that the school was in New England). At that point, having been pared down dramatically, the data was running smoothly through Alteryx. I decided to output it as a hyper file, as that's the file type optimized for use with Tableau.
Making the Dashboard
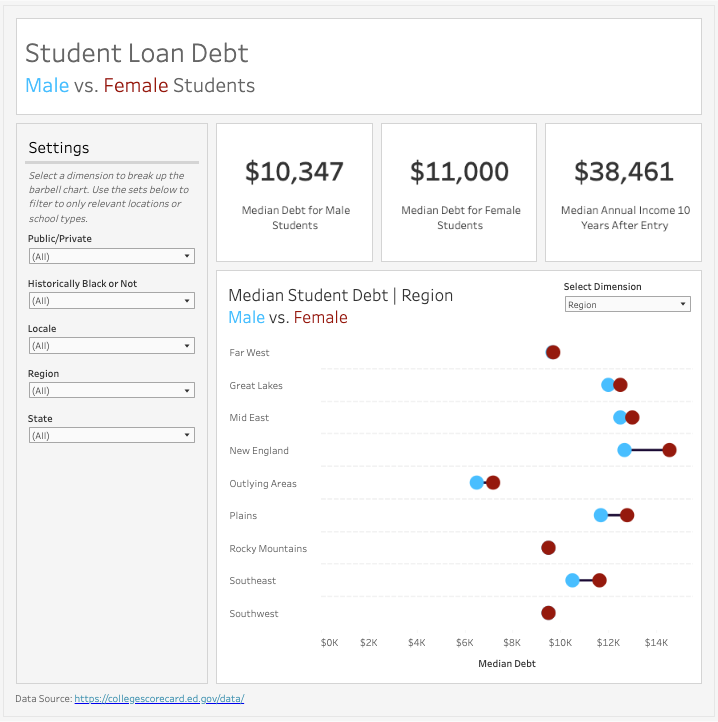
The pressure was really on after I had lost so much time prepping and exploring the data, as our main task was to create an exploratory dashboard. I had a rough idea of comparing student loan debt between male and female students. It finally clicked when I decided to create a barbell chart with each circle representing the median debt for either a male or female student. Then I could create a dynamic dimension that would vary depending on user input. So users could see median debt by gender broken down by region, locale, and other dimensions.
What surprised me about the data was that for every value of every dimension, women have a higher median debt. In the short time I had, I wasn't able to explore why that is but I'd be curious to investigate further. My best guesses would be either that women are subjected to discrimination when it comes to grants or they often attend more expensive schools or graduate schools.
The end result isn't bad considering the late start I got. Here's the link to view it on Tableau Public. One down, four to go!