Today our assignment was to work with data from UNICEF. We were given a link and told to download any dataset (or datasets) we wanted. Unlike yesterday, when our task was to create an exploratory dashboard, today we were told to "build an informative dashboard that will raise awareness about the issue and highlight your most important insights." This is pretty different from the business dashboards we usually make here so it was an interesting challenge.
My initial idea was to focus on data regarding literacy and numeracy rates. I thought it would be interesting to make a jitter plot with each collection of dots pertaining to the literacy or numeracy rate in a different region, with each dot representing an individual country (or area, as Pakistan was divided into four areas in the dataset). I planned to allow the user to use a few different dimensions to color the dots, like wealth (split into quintiles) and residence (whether the student lives in an urban or rural setting). I thought there would be some easily visible insights, like maybe students from rich families tend to have higher numeracy and literacy rates because they have better access to education.
After transforming the data in Alteryx to allow for this kind of analysis (mostly by transposing it into a long format rather than a wide format), I created the jitter plot, only to find that it looked like little more than a jumbled collection of dots. The trends that I had anticipated were there but they weren't as easily discernible from the chart as I had expected.
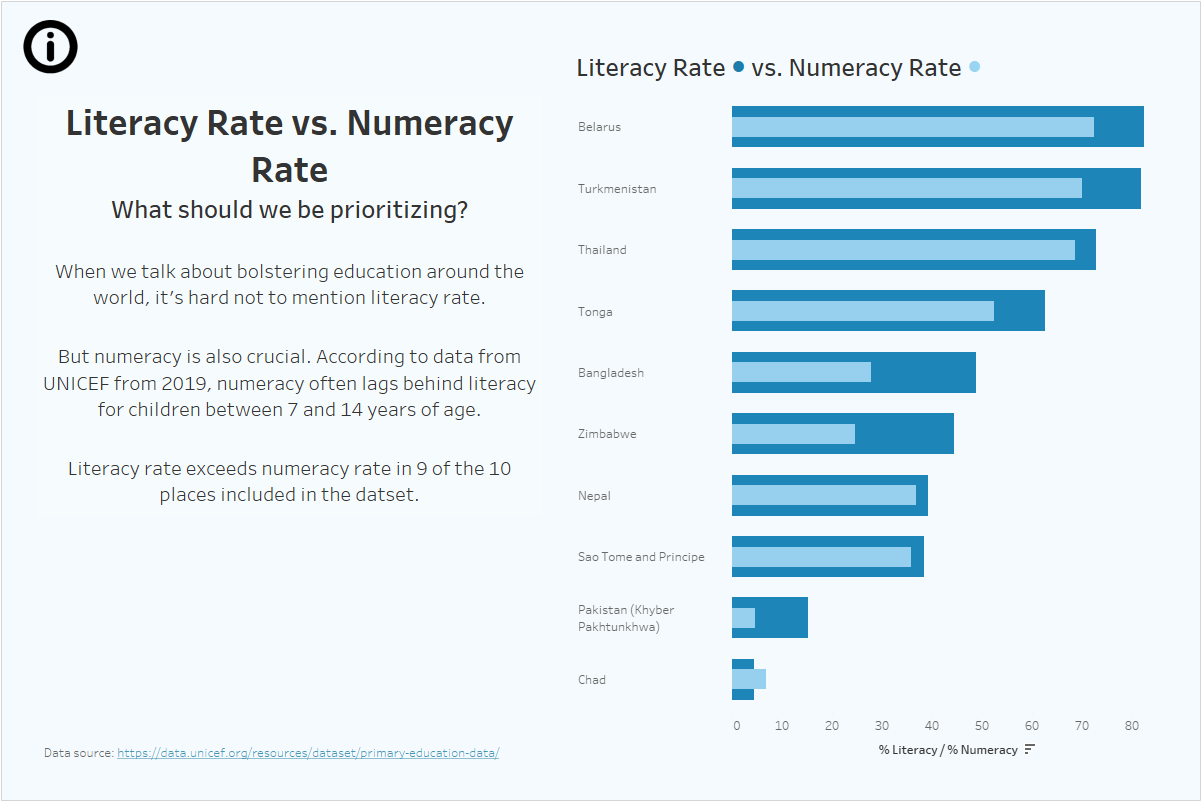
At this point, I decided to look for another dataset but after several dead ends, I ended up circling back to the original one with a different question: how do literacy and numeracy rates within the same country compare to each other? When people talk about promoting education in developing countries, they almost always talk about literacy rates. But in almost all of the countries in the dataset (there were only a few dozen countries included), the literacy rate for kids in 2nd and 3rd grade was higher than the numeracy rate. For kids 7 to 14 years old, that difference gets even larger.
Literacy is important and shouldn't be sacrificed for numeracy but it does seem like the reverse should also be true. This was an interesting finding that I hadn't expected. I decided to focus on this and make a bar-in-bar chart to show the difference in literacy and numeracy for each country in the dataset. For the sake of consistency, I opted to filter the data to kids 7 to 14 years old in the year 2019 (the year with the most available data). For obvious reasons, I only included the countries/areas where both the numeracy rate and the literacy rate were non-null. Here's a link to the dashboard on Tableau Public.